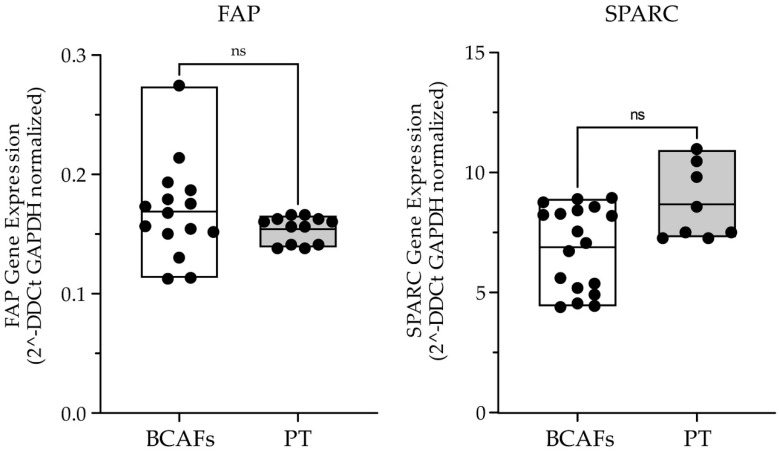
Figure 3.
Real-Time Expression analysis of the CAF markers FAP and SPARC in human primary BCAFs (N = 3) and BC patient tissues (PT) (N = 3). Data are shown as percentage of mean +/− SD from triplicates of three independent experiments. Statistical analyses were conducted by one-way ANOVA with Tukey’s post hoc analysis. ns: not significant.

