Figure 4.
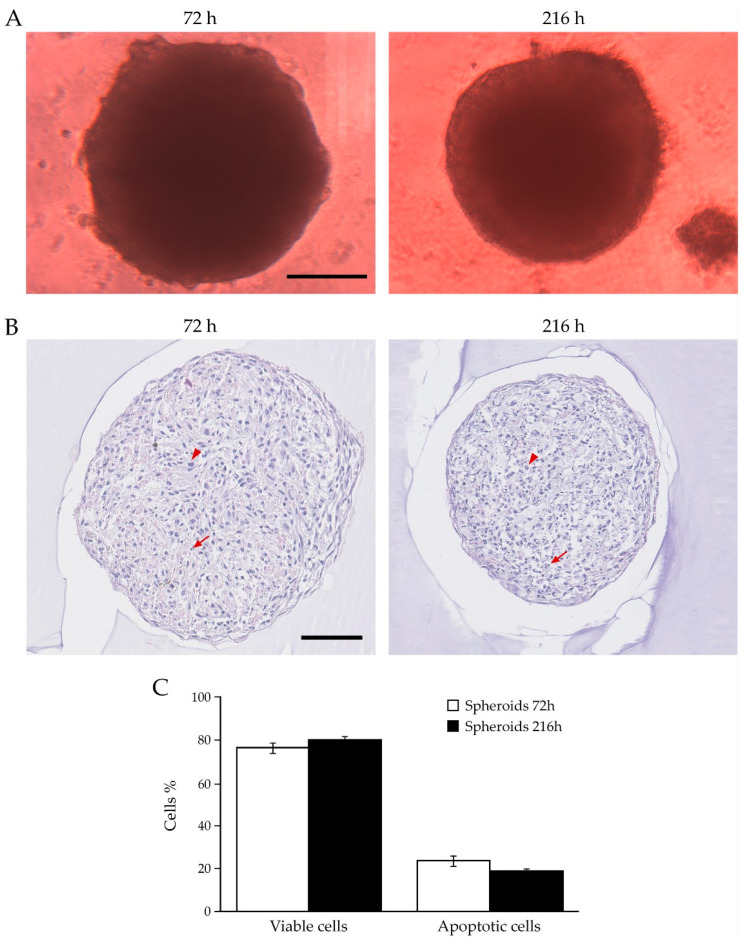
Analysis of BCAFs grown as spheroids. (A) Representative images of BCAF spheroids at 72 h and 216 h by phase-contrast microscopy. Scale bar 200 μm. Magnification ×10. Volumes of spheroids collected at 72 and 216 h were 0.109 mm3 ± 0.0075 and 0.0864 ± 0.0057, respectively. Data are reported as means of at least three independent experiments ± S.E. p < 0.05. (B) Hematoxylin and eosin staining of paraffin-embedded sections of BCAF spheroids collected at 72 and 216 h of 3D cell culture. Arrowheads indicate viable cells, while arrows indicate apoptotic cells. Scale bar 100 μm. Magnification ×20. (C) Live and apoptotic cell graph of spheroids collected at 72 h and 216 h.

