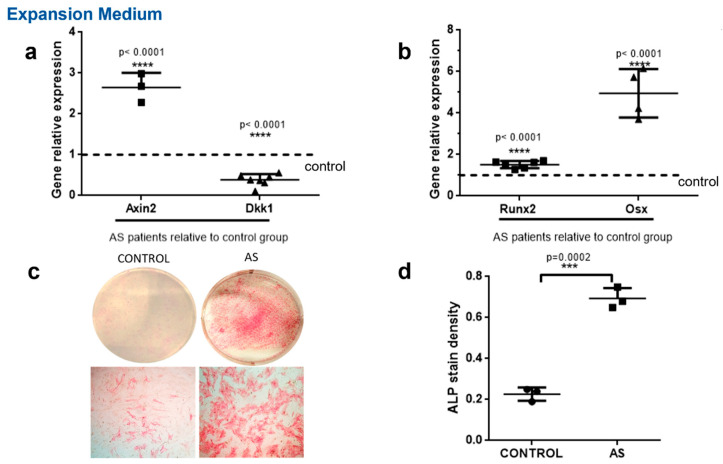
Figure 1.
Decreased DKK1 expression and increased WNT pathway activity in MSCs from AS patients. MSCs from the control group and the AS group were cultured in vitro in expansion medium. (a,b) Axin2, Dkk1, Runx2 and Osx expression levels were determined with the quantitative RT-PCR method. Each gene’s expression is presented as a fold expression in AS cells relative to the control group expression normalized to unity. (c,d) ALP activity in cultured cells. (c) Macroscopic images of the culture dishes (top row) and representative microscope images (bottom row). (d) Scatter plots depicting the quantification of ALP stain density. Data are presented as mean ± SD. *** = p < 0.001; **** = p < 0.0001.

