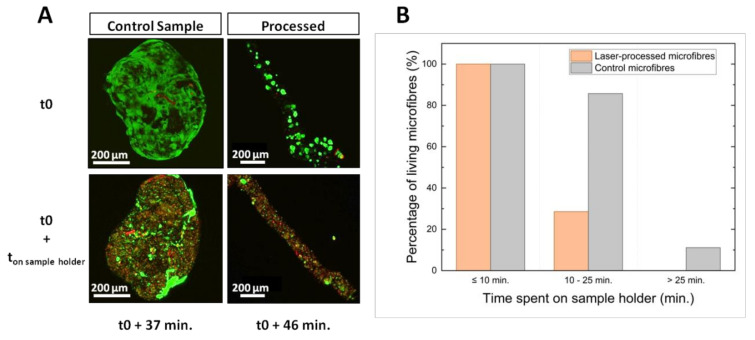
Figure 5.
Evolution of cellular viability according to microfibre hydration. (A) Confocal microscope images of two microfibres (one control microfibre and one laser-processed microfibre) stored in culture medium (t0) and the same microfibres 37 and 46 min after the culture medium was removed. Only the processed microfibre received laser treatment. (B) Histogram showing the percentage of microfibres still alive after 24 h as a function of the time spent on the sample holder with only a small amount of culture medium for the group of laser-processed microfibres (orange) and the group of control microfibres (grey).

