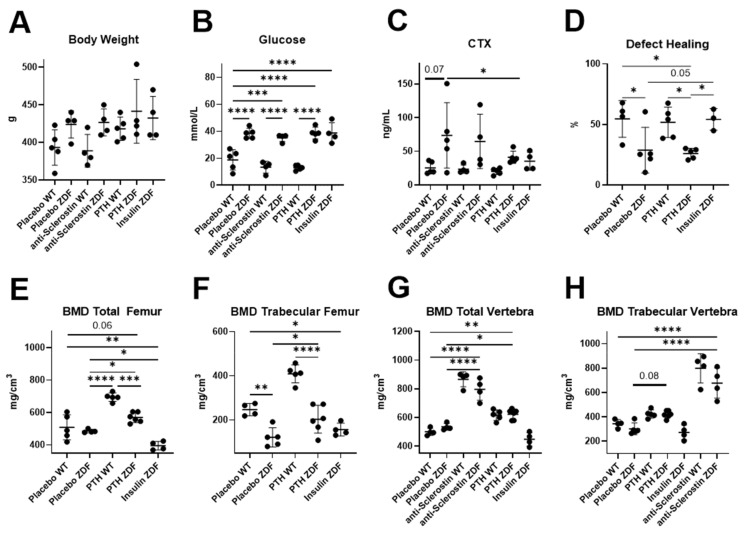
Figure 1.
Re-analyzed characterization of animal phenotypes. Metabolic parameters (A–C), as well as femoral (D–F) and vertebral bone parameters (G,H), were evaluated. Ex vivo micro-CT analyses were performed to determine BV/TV and BMD (placebo WT, n = 5; placebo ZDF, n = 5, PTH ZDF, n = 5; insulin ZDF, n = 4; anti-scl ZDF, n = 4). Scatterplots show mean ± SD. Two-way ANOVA analysis was performed. p < 0.1 shown in numeric values, * p < 0.05, ** p < 0.01, *** p < 0.001, **** p < 0.0001.

