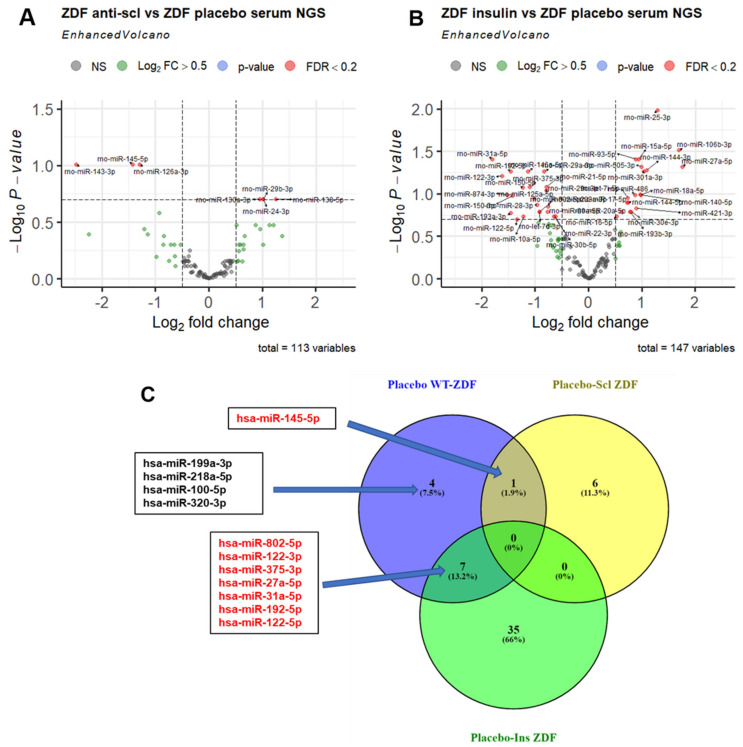
Figure 3.
NGS-based discovery of miRNA changes in serum of ZDF rats under anti-sclerostin and insulin treatment compared to placebo treatment. (A,B) Volcano plots depict the log2-transformed fold change and log10-transformed adjusted p-values for the contrast (ZDF placebo, n = 5 vs. ZDF treatment, n = 4) in serum. miRNAs with Benjamini–Hochberg-adjusted p-values < 0.2 (FDR < 20%) are highlighted as separate group in red. (C) VENN comparison of miRNAs dysregulated in placebo-treated ZDF vs. WT rats (left circle) and miRNAs affected by either insulin (bottom circle) or anti-sclerostin treatment (right circle) (FDR < 20%). miRNAs that are dysregulated in the ZDF model and rescued by treatment are highlighted in red.

