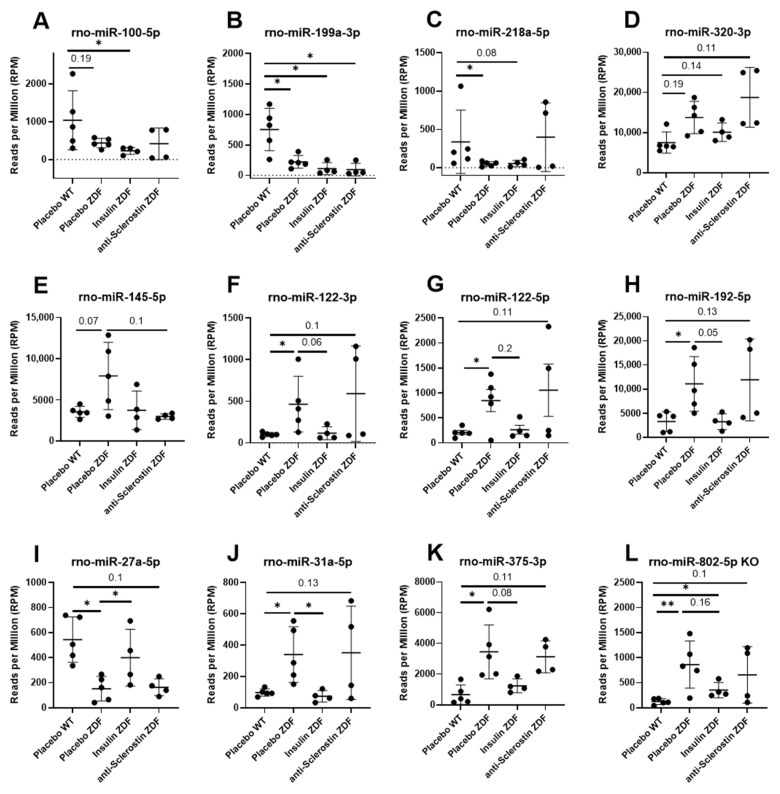
Figure 4.
MicroRNA scatter plots. Representation of circulating miRNAs not rescued by any treatment (A–D), rescued by anti-sclerostin (E), or insulin (F–L) treatments. Placebo WT, n = 5; placebo ZDF, n = 5, PTH ZDF, n = 5; insulin ZDF, n = 4; anti-scl ZDF, n = 4. Scatterplots show mean ± SD. Testing was performed using edgeR as described in the Materials and Methods Section. FDR < 0.1 shown in numeric values, * FDR < 0.05, ** FDR < 0.01.

