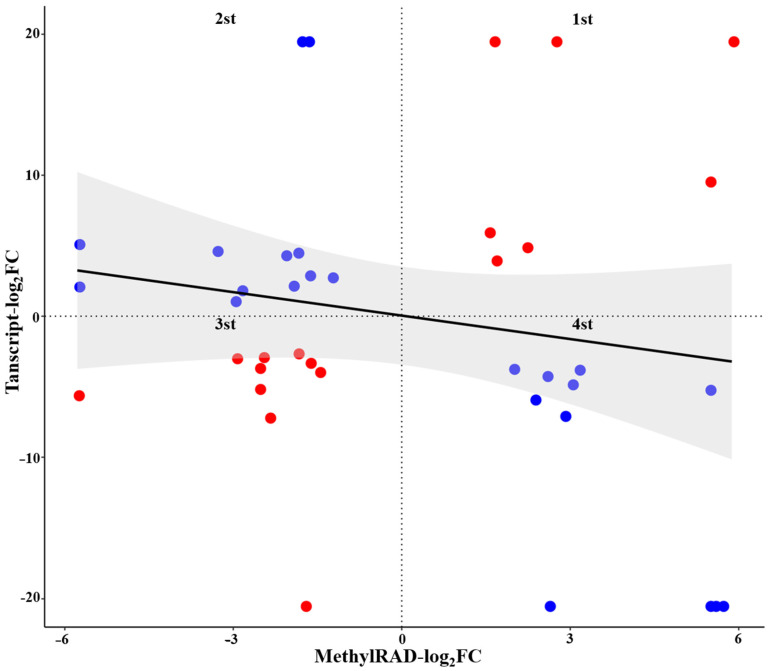
Figure 8.
The correlation between differentially expressed genes (DEGs) and differentially methylated genes (DMGs). Note: Red dots indicate that the methylation level of the gene is negatively correlated with its expression level, and blue dots indicate that the methylation level of the gene is positively correlated with its expression level. The grey shadow indicates that the correlation between the methylation level and expression level is not significant (p > 0.05).

