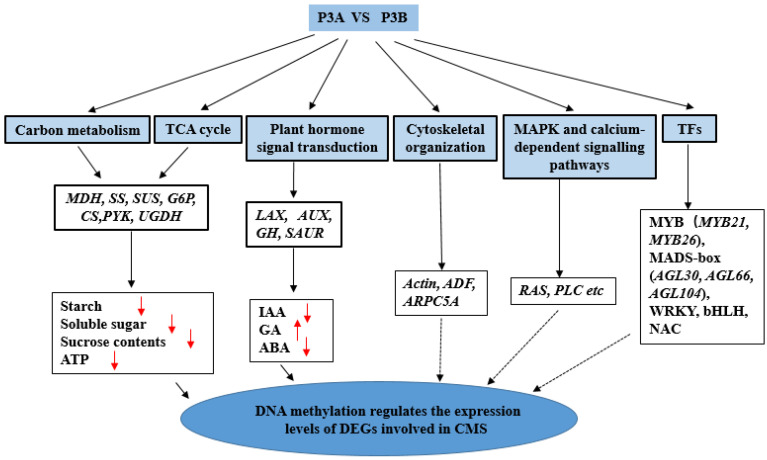
Figure 9.
A model for the changes in DMGs and DEGs contributing to CMS in kenaf. Note: The upwards red arrowhead indicates that the content of this indicator is significantly increased in P3A, and the downwards red arrowhead indicates that the content of this indicator is significantly decreased in P3A. The solid line indicates that there has been sufficient and in-depth research, while the dotted line indicates that further in-depth research and verification are needed.

