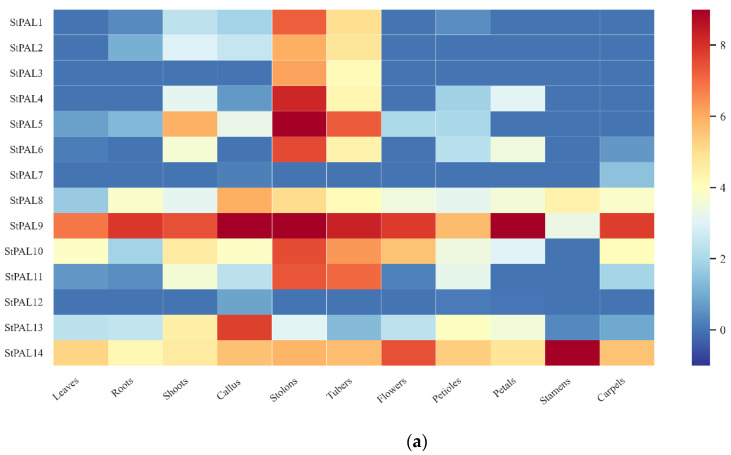
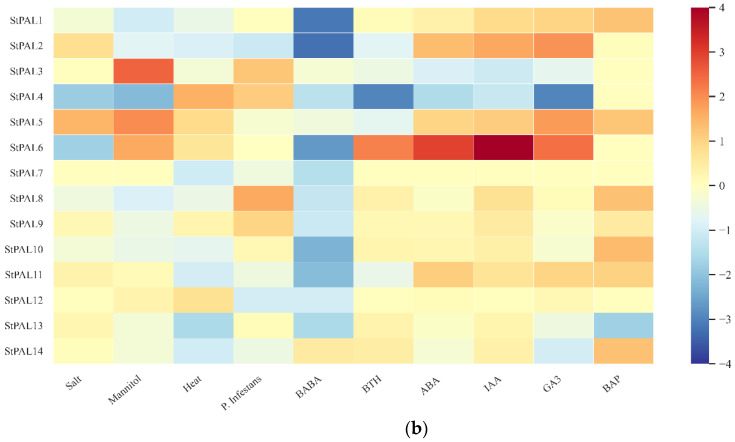
Figure 7.
(a) Heatmap shows the expression of the StPAL gene in 12 tissues, including the leaves, roots, shoots, callus, stolons, tubers, flowers, petioles, petals, stamens, and carpels. Red indicates high relative gene expression, whereas blue indicates low relative gene expression. (b) Heatmap of the expression profile of potato PAL genes under 10 different biotic or abiotic stresses. Abiotic stresses included salt, mannitol, and heat; biotic stresses included P. infestans, β-aminobutyric acid (BABA), benzothiadiazole (BTH), and P. infestans; other stress responses were mainly induced by the following four plant hormones: 6-benzylaminopurine (BAP), auxin (IAA), abscisic acid (ABA), and gibberellin glutathione (GA3). Red indicates gene upregulation, while blue indicates gene downregulation.


