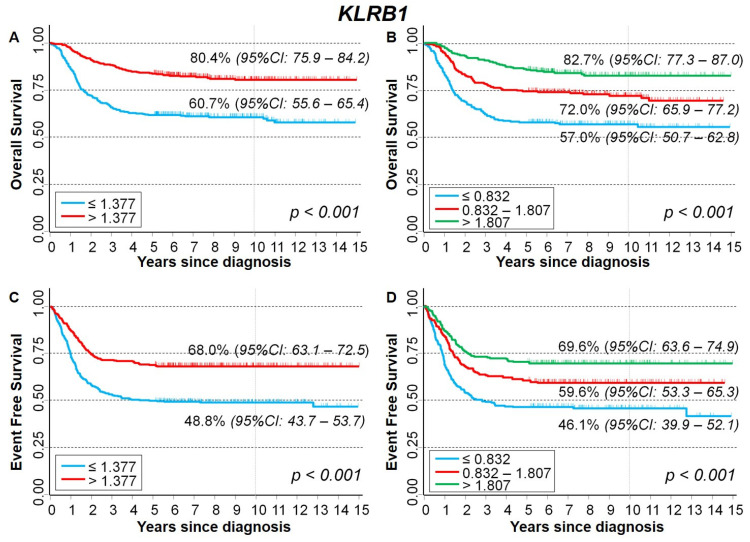
Figure 7.
Kaplan–Meier survival curves of the whole cohort of 786 NB patients in relation to KLRB1 gene-expression values. (A) Overall survival, cut-off based on the median expression value; (B) Overall survival, cut-offs based on tertile expression values. (C) Event-free survival, cut-off based on the median expression value; (D) Event-free survival, cut-offs based on tertile expression values. Ten-year survival estimates are displayed.

