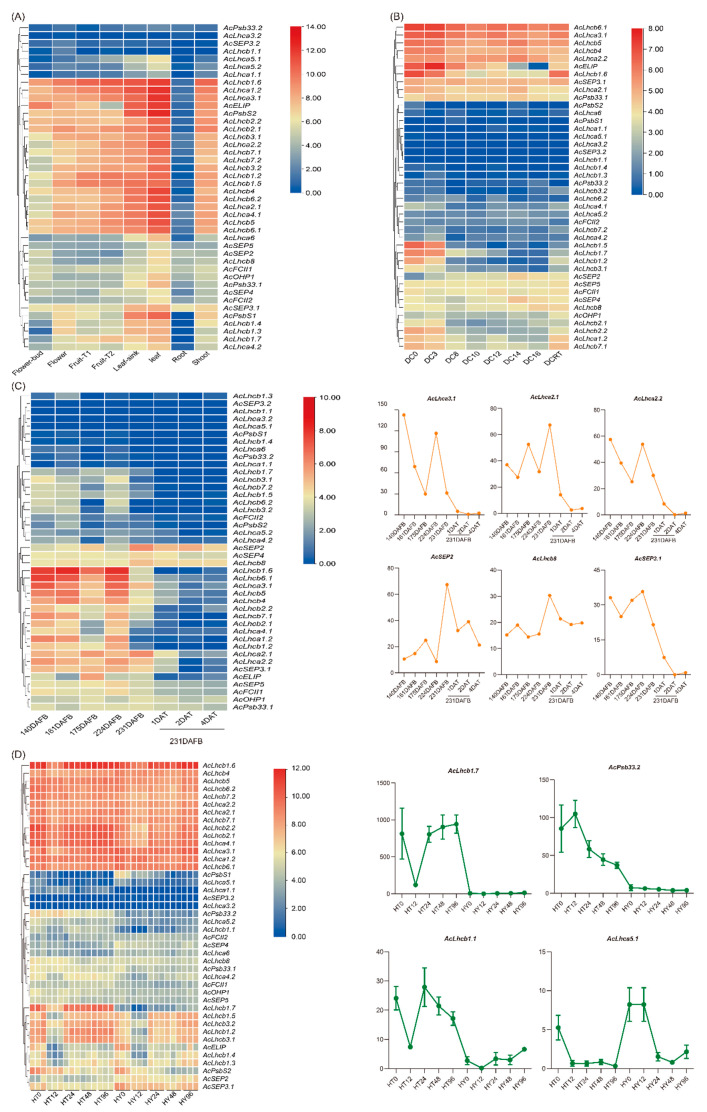
Figure 3.
Expression profiles of AcLHC genes in different tissues, fruit developmental stages, and under different treatments. The bar at the right of each heat map represents expression values. (A) Expression profiles of AcLHCs in eight different tissues (flower bud, flower, fruit T1: no ethylene production, fruit T2: autocatalytic ethylene production, leaf sink, leaf, root, and shoot). (B) Expression profiles of AcLHCs in mature fruit exposed to eight different temperatures in storage for two days. DC, degrees celsius; RT, room temperature. (C) Expression profiles of AcLHCs in the fruit developmental stages and samples treated with ethylene. DAFB, days after the full bloom of fruit; DAT, day after being treated with ethylene. (D) Expression profiles of AcLHCs in two kiwifruit cultivars infected with Psa. Huate (HT) and Hongyang (HY) represented resistant and susceptible cultivars, respectively. The number following the cultivar’s name showed hours post the Psa invasion.

