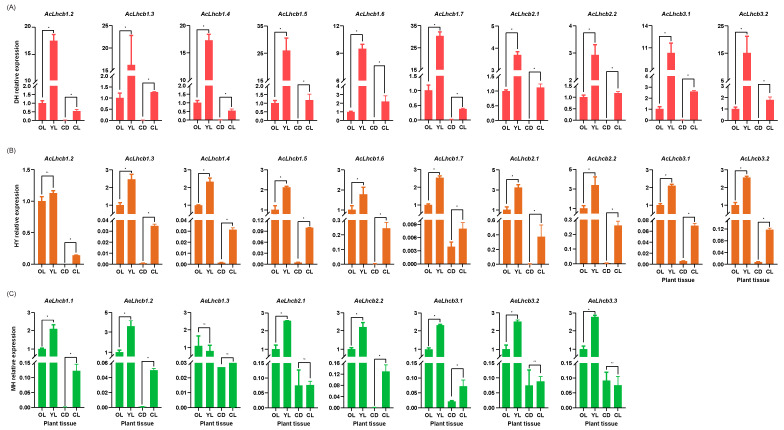
Figure 4.
Expression analysis of AcLHC and AeLHC genes using RT-qPCR in different tissues. Actin was used as the internal standard for each gene. (A) for DH, (B) for HY, and (C) for MH. The results are shown as mean values and standard deviation of three biological replicates of different tissues and three technical replicates in each biological sample. The y-axis was the relative expression level. * indicated significant differences accorded to Tukey’s multiple range tests (*, p < 0.05). OL, old leaves; YL, young leaves; CD, callus tissues under dark condition; CL, callus tissues under light condition; DH, ‘Donghong’; HY, ‘Hongyang’; MH, ‘Maohua no.1’.

