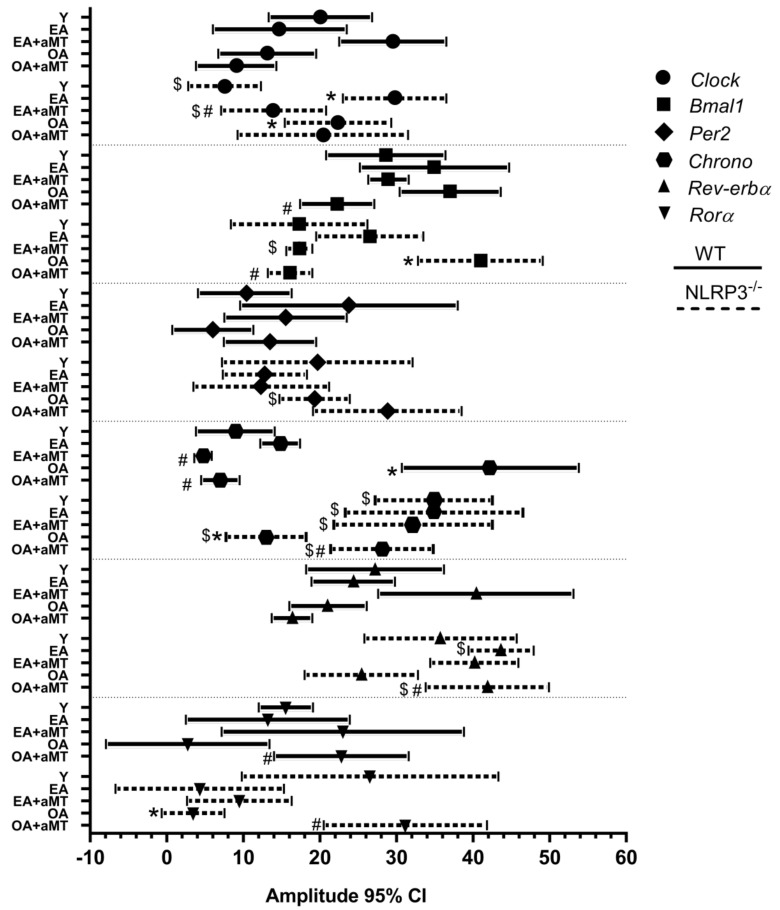
Figure 4.
Amplitude chart showing peaks of fitted 24 h cosine for clock genes analyzed in the heart of WT and NLRP3−/− mice during aging and melatonin treatment. Amplitude of clock genes Clock, Bmal1, Per2, Chrono, Rev-erbα, and Rorα in hearts of young (Y), early-aged (EA), early-aged with melatonin (EA + aMT), old-aged (OA), and old-aged with melatonin (OA + aMT) wild type (solid line) and NLRP3−/− mice (dashed line). Data are expressed as means ± confidence interval (CI) of the amplitude when p was ≤ 0.05 from the nonzero amplitude. Data of significant differences among the experimental groups were evaluated by overlapping of confidence interval and are detailed in Supplementary Table S2. * p < 0.05 vs. Y; # p < 0.05 vs. group without melatonin treatment; $ p < 0.05 vs. WT mice.

