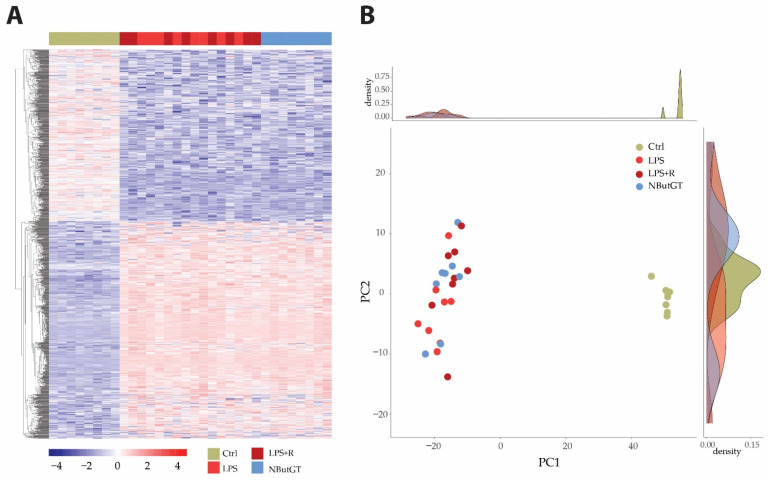
Figure 2.
Heatmap and principal component analysis. Transcriptome analyses were made from whole heart of rats injected with saline (CTRL), LPS (LPS) treated with either fluidotherapy (LPS + R) or NButGT (NButGT), and this allowed the identification of 13730 genes. Differentially expressed genes (DEGs) were selected by their fold change of expression between 2 conditions log2Ratio(Fold change)>1 or log2Ratio(Fold change)>−1 and an adjusted p value < 0.05 using the R package “Deseq2”. Heatmap visualization (A) of the 1483 DEGs with the comparison Ctrl vs. LPS and the 1 DEG with the comparison LPS vs. LPS + R showed that Ctrl and NButGT rats were well clustered but LPS and LPS + R showed no clusterization. Plotting of individuals and frequencies from Principal Component Analysis (PCA) of DGEseq data using R statistical language showed Ctrl rats clustered but no separation of LPS, LPS + R and NButGT individuals (B).

