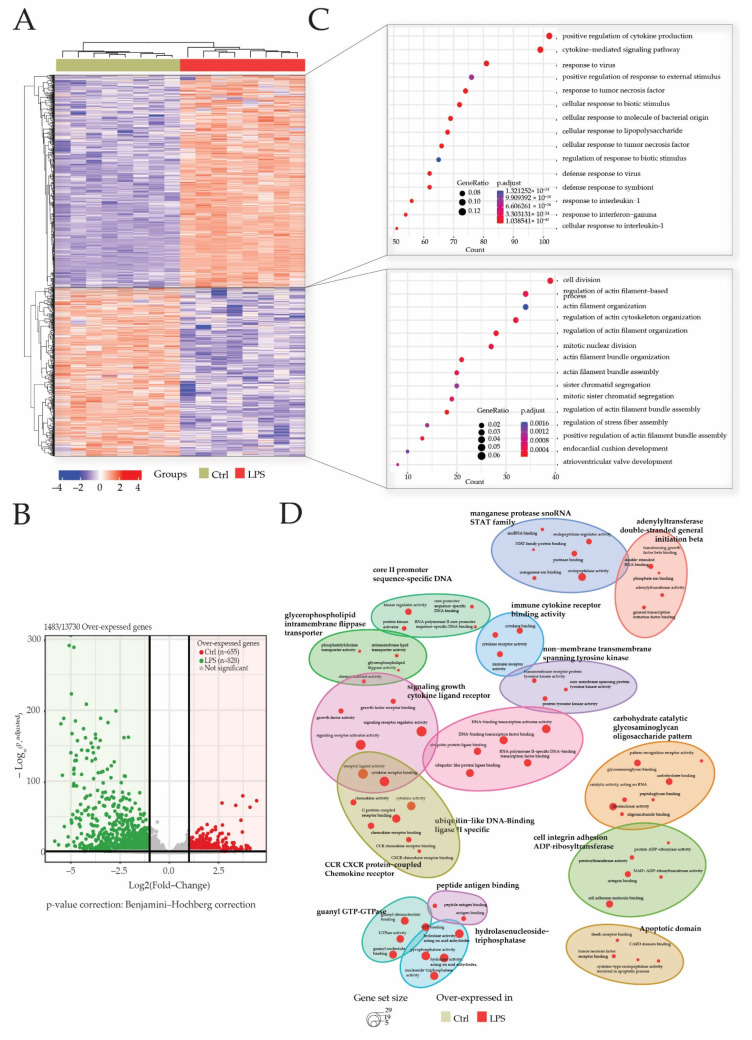
Figure 3.
LPS injection promotes cytokine and inflammatory pathways. Transcriptome analyses were made from whole heart of rats injected with LPS (LPS) or saline (CTRL), and this allowed the identification of 13730 genes. Differentially expressed genes (DEGs) were selected by their fold change of expression (log2Ratio(LPS/CTRL) >1 or (log2Ratio(LPS/CTRL) >−1 and an adjusted p value < 0.05 using the R package “Deseq2”. Heatmap visualization (A) of the 1483 DEGs showed that groups were well clustered and revealed two main clusters of overexpressed genes, respectively, in the LPS group and CTRL group. Log10 (p.adjusted) and log2FoldChange of these DEGs are represented in the volcano plot (B). Gene ontology (GO) enrichments were conducted to decipher biological processes in which DEGs were mostly involved in both clusters (C) and within the comparison of both clustered (D).

