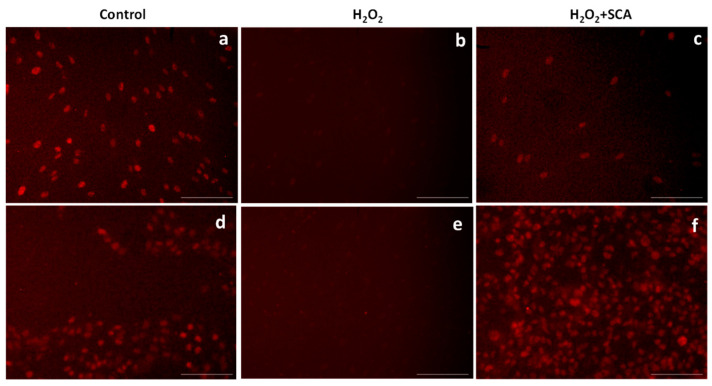
Figure 5.
Treatment with SCA® markedly induced SIRT1 expression in senescent cells. Representative fluorescence microscopy images after SIRT1 (red) immunostaining. Cells treated with H2O2 (b,e) showed decreased expression of SIRT1. Fibroblasts (a–c) and B16-F10 cells (d–f) were exposed to H2O2 and treated with SCA® (c,f). Scale bars: 200 μm.

