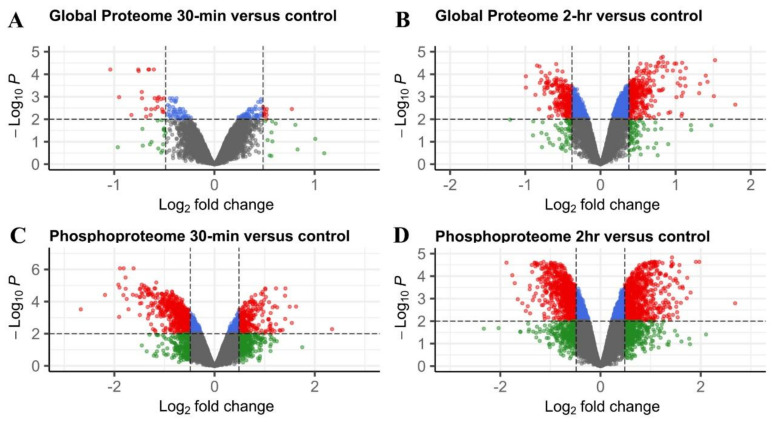
Figure 3.
Volcano plot visualization of cold-responsive proteins (A,B) and phosphopeptides (C,D) under 30 min (A,C) or 2 h (B,D) of cold treatment. Cold-responsive proteins or phosphopeptides are depicted in red. X-axis is the Log2 of fold change (treatment /control) and Y-axis is the negative Log10 of the p value for independent t-test adjusted by the Benjamini–Hochberg procedure. Vertical dashed lines denote a fold change cutoff in either direction. The horizontal dashed line represents a cutoff of an adjusted p value of 0.01.

