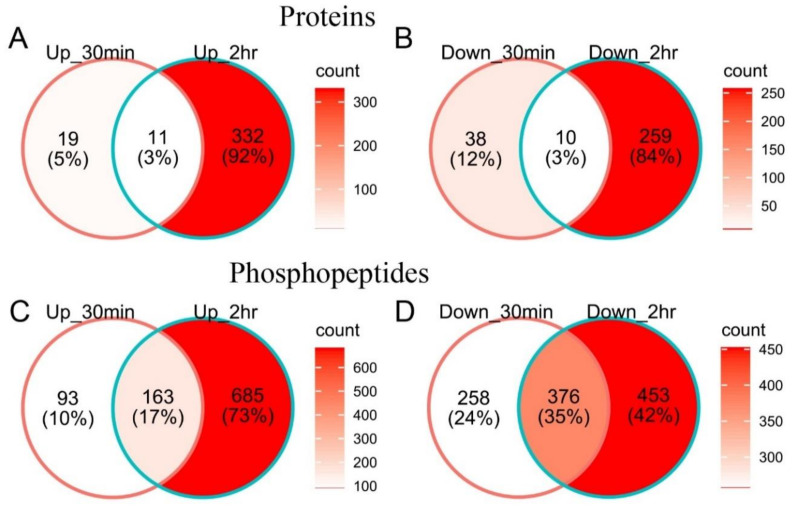
Figure 4.
Venn diagram showing numbers of cold-responsive proteins (A,B) and phosphopeptides (C,D) of maize seedlings under different cold-shock durations (30 min and 2 h). Numbers of up-regulated (A,C) and down-regulated (B,D) ones were listed separately. Color in each region is coded according to the count of observations contained therein.

