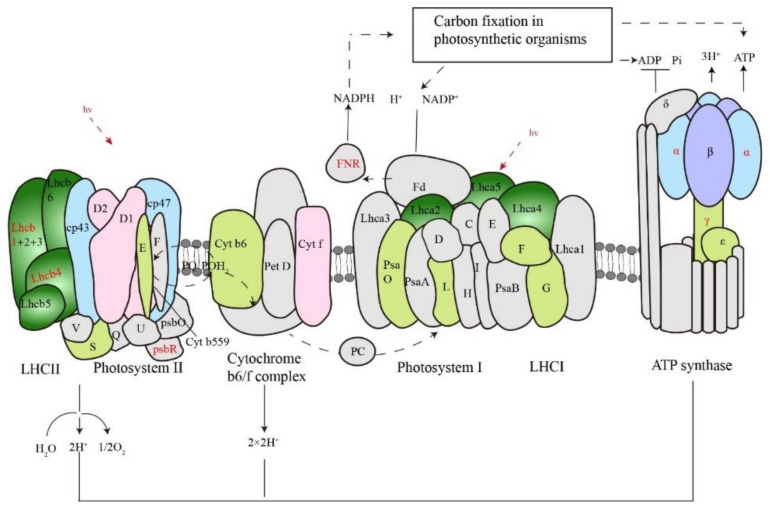
Figure 8.
Schematic diagram of photosynthetic complexes on the thylakoid membrane. Cold-responsive proteins at protein abundance levels are shown in colors, while those unquantified or not-responsive are shown in gray. Proteins responsive to cold at site-specific phosphorylation levels are shown in red fonts.

