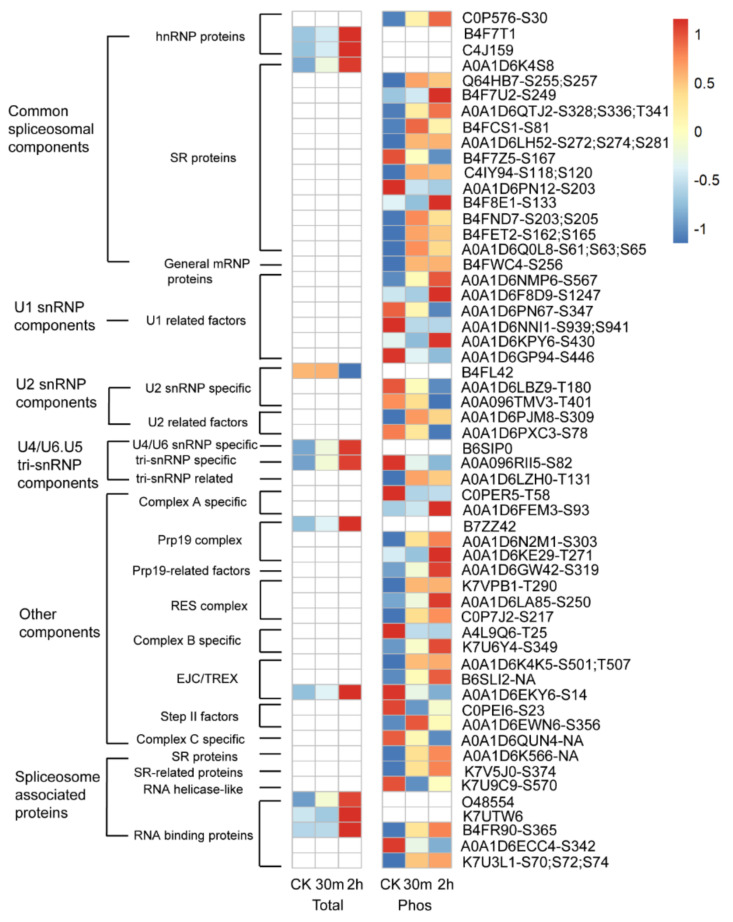
Figure 9.
Expression profiles of cold-responsive spliceosome proteins at protein abundance (Total) or site-specific phosphorylation levels (Phos). Protein and phosphopeptide intensities were log2 transformed and scaled for display. Dark blue to dark red color gradient denotes lower to higher expression. One representative phosphopeptide of each phosphoprotein is shown. The accession numbers and the respective phosphosites are listed on the right of the panel. “NA” indicates the phosphosites were not confidently determined (ptmRS site probability < 75%).

