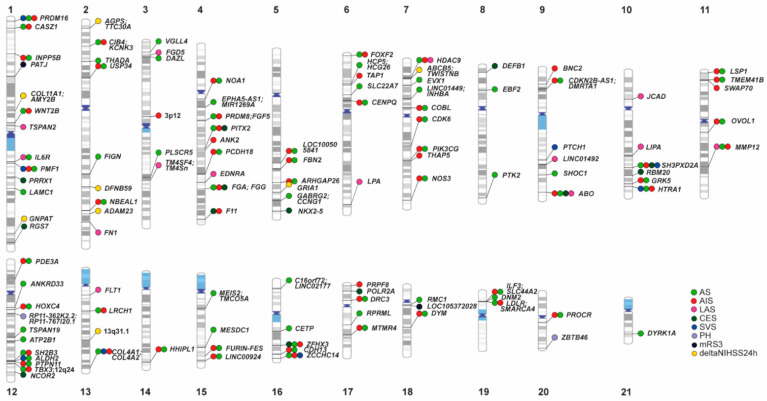
Figure 1.
Genetic loci influencing stroke phenotypes. Ideogram of genomic regions influencing stroke phenotypes; colored circles represent genome-wide significant loci in published studies. Colors correspond to associated stroke phenotypes (green, AS: All Strokes; red, AIS: All Ischaemic Strokes; pink, LAS: Large-artery atherosclerosis Stroke; dark green, CES: Cardioembolic Strokes; blue, SVS: Small Vessel Stroke; purple, PH: Parenchymal Hematoma; black, mRS3: modified Rankin Scale three months after stroke; yellow, deltaNIHSS24 h: difference between NIH stroke scale (NIHSS) within six hours of stroke onset and NIHSS at 24 h. Prioritized genes in the original publications are displayed.

