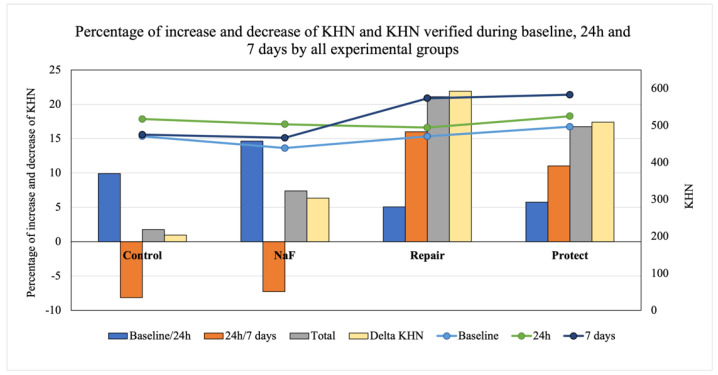
Figure 4.
Analysis of microhardness (Knoop hardness—KHN) of the bovine enamel subjected to bleaching and treated with each material over time. Bars represent the percentage increases and decreases in KHN and KHN verified at baseline and at 24 h and 7 days after treatment for all experimental groups. Gray bars represent microhardness gain after the time allowed to elapse for each treatment. Yellow bars represent the percentages of variations considering initial and final KHN values measured at different times according to each material. Rows show KHN raw values for each group. Blue row—KHN at baseline; green row—KHN at 24 h; dark-blue row—KHN at 7 days.

