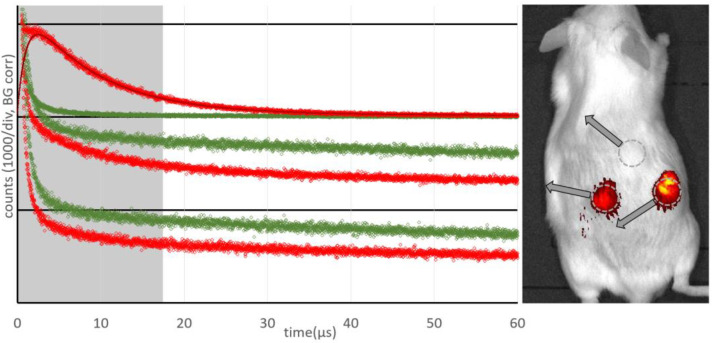
Figure 2.
Phosphorescence kinetics in vivo recorded for healthy tissue including a typical fit (top), at a tumor (middle) and at a necrotic tumor (bottom) for wavelengths around 1200 nm (green) and 1270 nm (red). Detection spots are indicated in the fluorescence image overlay of the mouse with a cutoff at 30% of maximum intensity (right).

