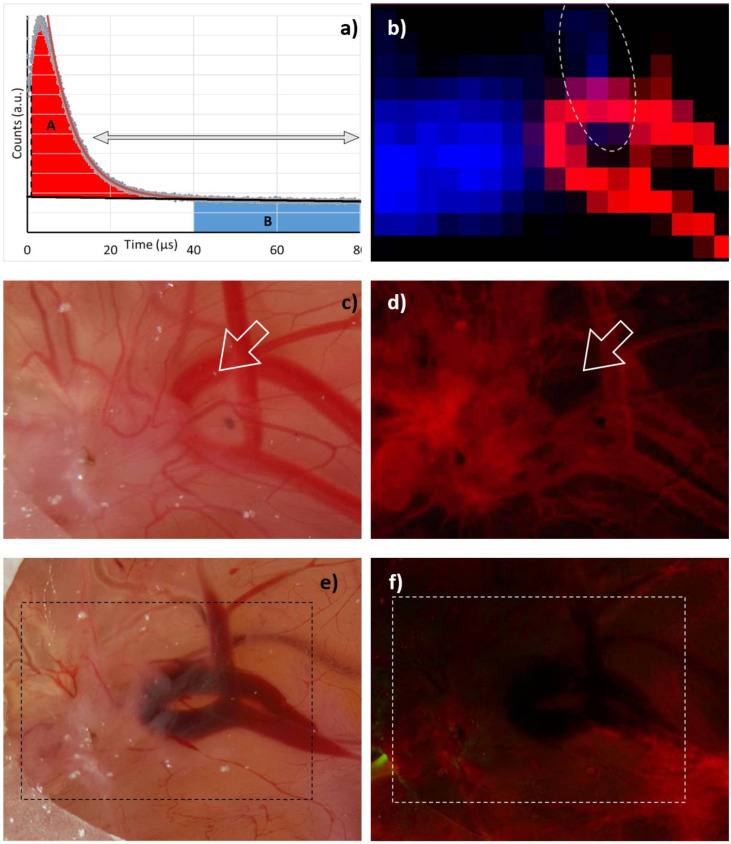
Figure 3.
(a) Robust data analysis based on a double exponential decay fit (red curve) within the time range indicated by the arrows (15–80 µs). The longer decay time from this fit is considered to be the lifetime of PS phosphorescence in tissue (black). The relative 1O2 intensity is determined from the difference between signal and PS phosphorescence (light red marked area - A) omitting the first 1 µs. Relative PS phosphorescence intensity is determined from the blue marked area (B) from 40 to 80 µs. (b) 2D plot of A (red) and B (blue) as determined at gritted positions across the HET-CAM area. Values below 10% of the corresponding maximum value are black. Photograph and fluorescence image of the investigated area before (c,d) and after (e,f) measurement.

