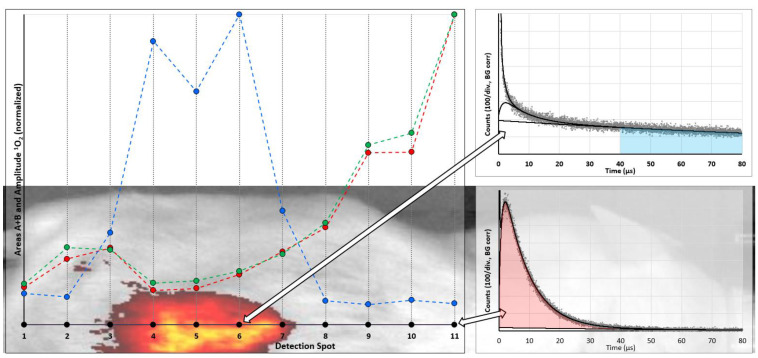
Figure 4.
Results of measurements at 11 spots (black dots) along a line across the mouse skin, crossing the tumor. The overlay with the fluorescence image of the mouse indicates the exact locations. PS phosphorescence intensity was determined by summing up the signal in the range of 40–80 µs after laser pulse, corrected for background (blue). Relative 1O2 intensity is shown for two ways to analyze the data: the amplitude of the 1O2 component determined by fitting of the kinetics (green) and robust data analysis as explained in the text (red). For detection spots 6 and 11 the determined phosphorescence kinetics are shown on the right (indicated by the arrows), where red and blue areas are again the graphical representation of the values determined by the robust data analysis.

