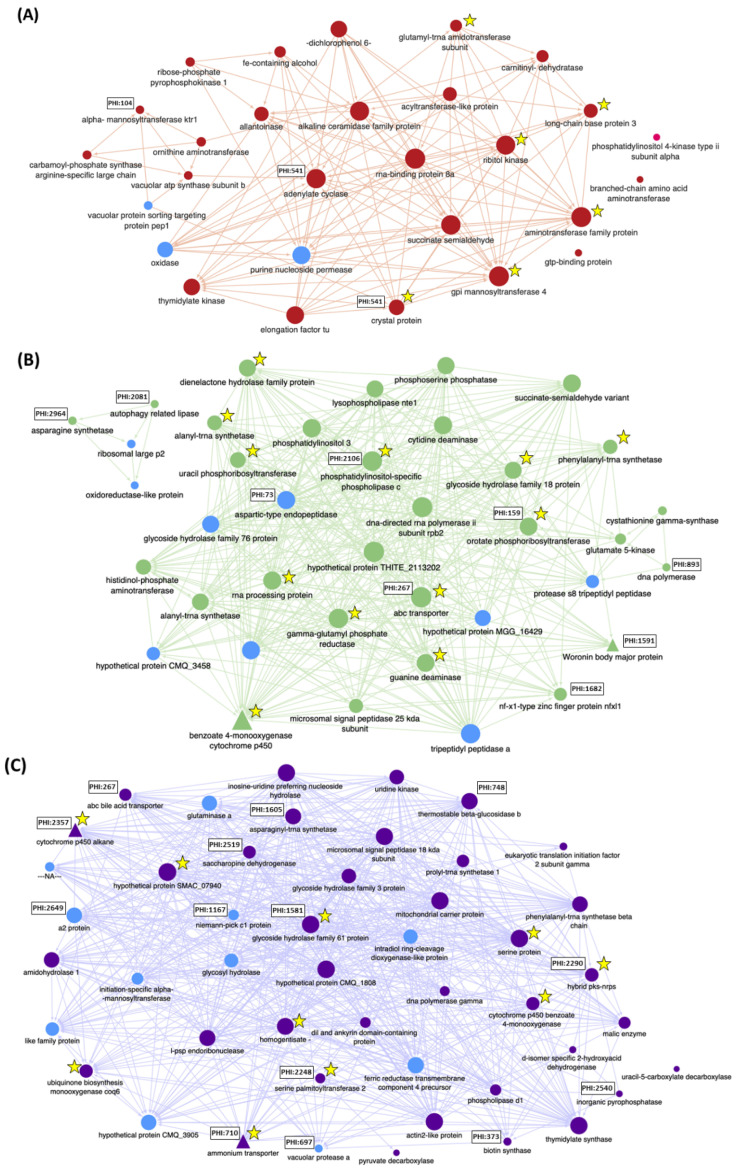
Figure 4.
Interaction networks for selected genes in weighted-gene co-expression network analysis modules Darkred (A), Green (B) and Purple (C) that were associated with higher Ohiostoma novo-ulmi ssp. americana gene expression in susceptible (S) Ulmus americana. Interactions are shown for genes associated with KEGG pathway classes, along with genes predicted to encode a secreted protein with a signal peptide (light blue), and genes for which knockdown- or knockout mutants (triangles) were obtained and tested. Genes upregulated in S elms are identified by a star. PHI-base identifier is shown for genes with orthologs in the PHI-base curated database of genes involved in host-pathogen interactions. The size of the gene symbol (circle or triangle) is proportional to the number of interactions with other genes in the module.

