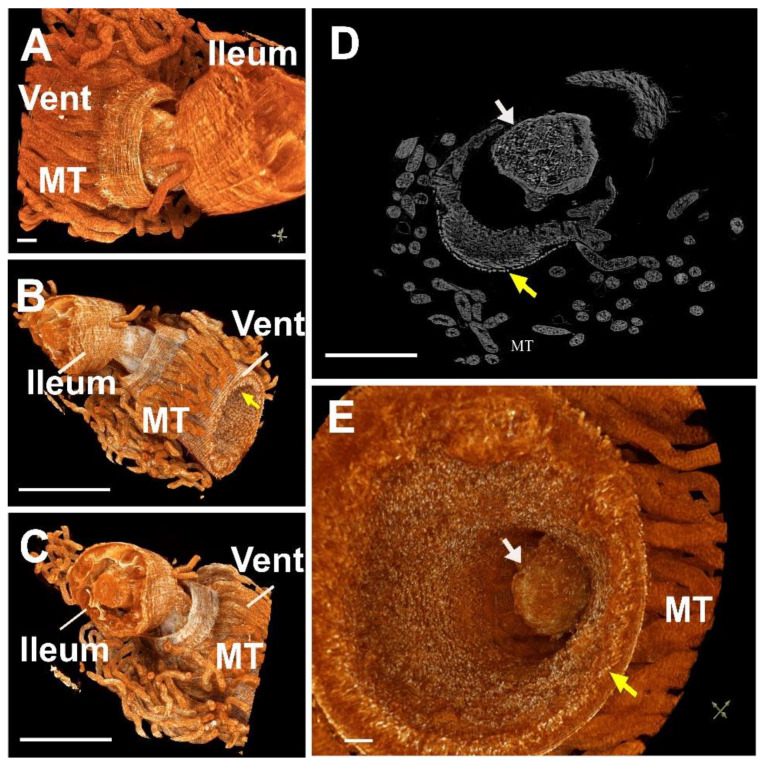
Figure 3.
Tomography images of the connection between the midgut and the hindgut through a pyloric valve. (A) The ventriculus with Malpighian tubules (MT) and peritrophic membrane (yellow arrows); (B,C) Ventriculus with highlighted ectoperitrophic space; (D) 2D image; (E) Highlighted ectoperitrophic space. Bars: (A,D,E) = 100 μM; (B,C) = 1 mm.

