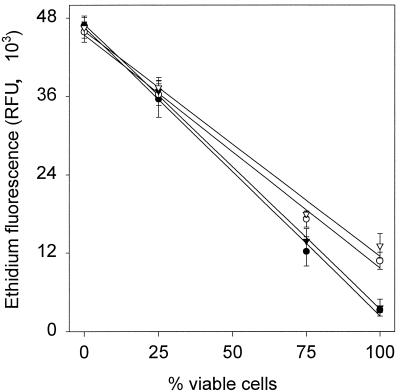
FIG. 3.
Correlation of EB fluorescence of starved (open symbols) and energized (black symbols) cells with the content of viable cells in the sample. Samples were prepared by mixing untreated cultures with cultures sterilized by heat (80°C, 10 min) (circles) or HP (800 MPa, 10 min) (inverted triangles). Symbols represent means ± standard deviations of three independent experiments.

