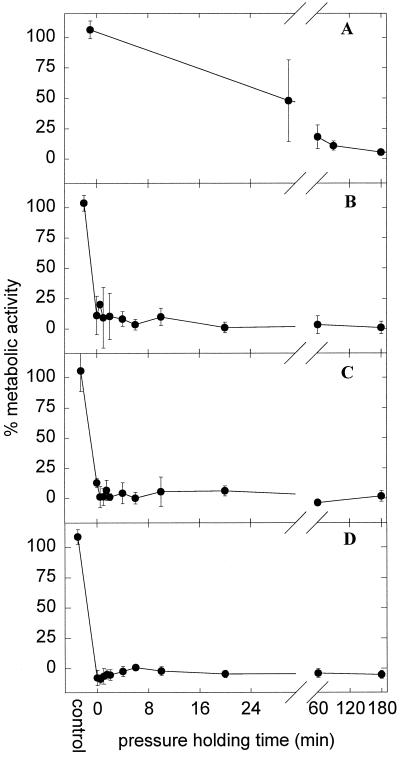
FIG. 5.
Kinetics of inactivation of L. plantarum TMW1.460 incubated at 200 (A) (n = 4), 400 (B) (n = 3), 500 (C) (n = 3), and 600 (D) (n = 2) MPa. Shown is the INT reduction rate of treated cells compared to the INT reduction rate of untreated cells. Symbols represent means ± standard deviations of n independent experiments.

