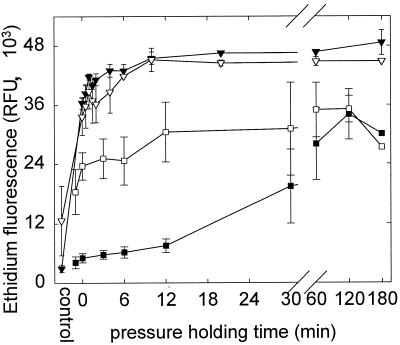
FIG. 7.
HorA activity of L. plantarum TMW1.460 after pressure treatment at 200 (n = 4) (squares) and 600 (n = 2) (inverted triangles) MPa. Shown is the EB fluorescence of cells incubated in phosphate buffer with 20 μmol of EB liter−1 for 90 min in the presence (black symbols) and absence (open symbols) of glucose. Symbols represent means ± standard deviations of n independent experiments.

