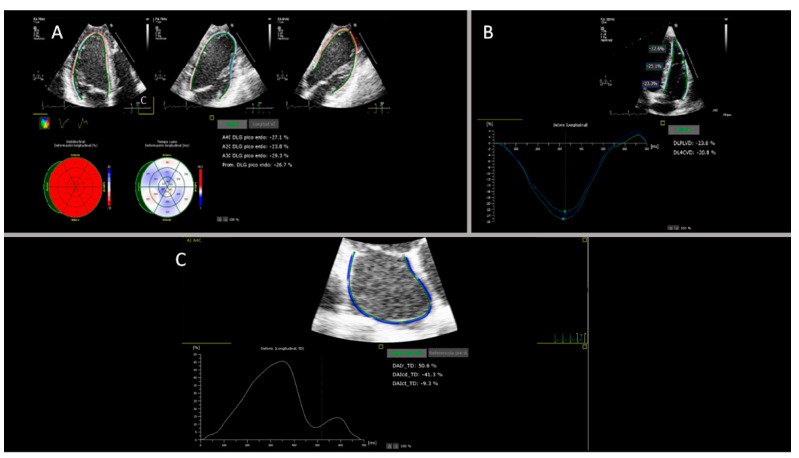
Figure 1.
Panel (A): Output of the left ventricular longitudinal strain analyses. The upper part shows, from left to right, the endocardial tracking of chambers four, two and three; the bottom left part shows the bull’s eye with the strain values (%) and the time to peak longitudinal strain (ms) for the 18 segments. On the bottom right part, the LVGLS results for chambers four, two and three and the average LVGLS (%) can be found. Panel (B): Output of the right ventricular longitudinal strain analyses. The upper part shows the endocardial tracing in the four apical chambers: basal, medial, apical and RVFWLS: (%). The bottom left part shows the deformation curves versus the time for each segment (coloured curves). On the right, the results of the average RVFWLS and the average RV4CLS (%) are found. Panel (C): Output of the left atrium longitudinal strain analyses. At the top is the apical four-chamber endocardial tracing; at the bottom left is the strain versus time curve, and at the bottom right, the GLS results for each of the phases of the atrium (reservoir, conduit and contraction) (%) can be found.

