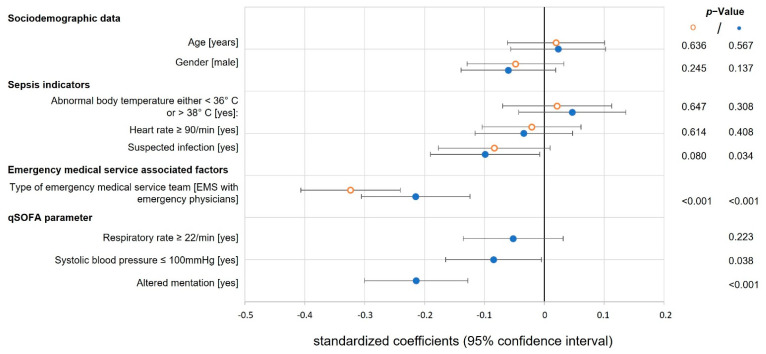
Figure 4.
Time to fluid resuscitation. The forest plot shows the standardized coefficients with 95% CI (x-axis) and p-values for each covariable regarding the secondary endpoint ‘time to fluid resuscitation’ of two multiple linear regression models (n = 702 cases): model without qSOFA (orange ᵒ dot) and model with additional qSOFA parameters (blue • dot); time is logarithmized; the vertical solid line marks a standard coefficient of zero, a shift to the right indicates a prolonged and to the left side a shortened ‘time to fluid resuscitation’; qSOFA: quick sequential organ failure assessment.

