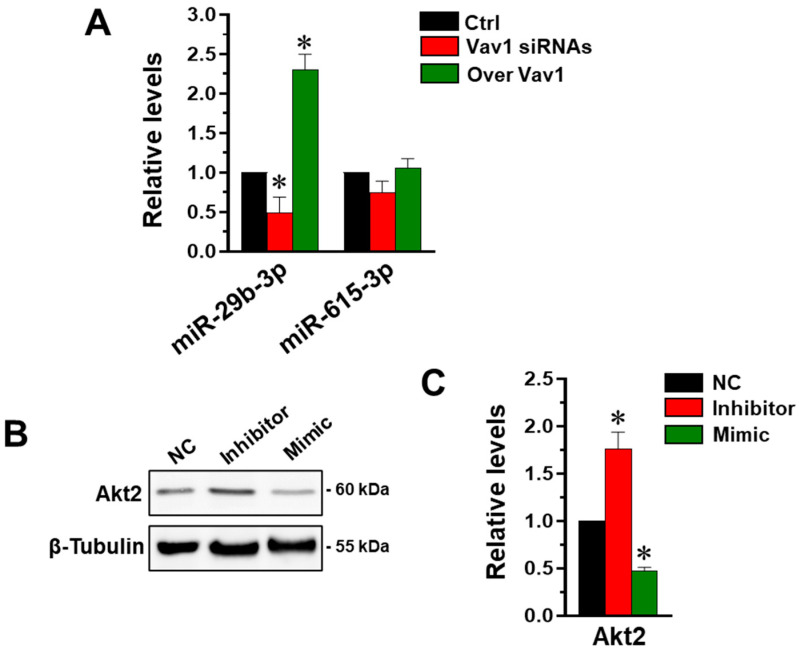
Figure 2.
Correlation between Vav1, miR-29b and Akt2 in MDA-MB-231 cells. (A) qRT-PCR analysis of miR-29b-3p and miR-615-3p in MDA-MB-231 cells in which Vav1 was down-modulated or over-expressed. The values were determined using the 2 −ΔΔCT method and the asterisks indicate statistically significant differences compared to respective controls (Ctrl) taken as 1. (B) Representative immunoblot analysis of Akt2 in lysates from MDA-MB-231 cells transfected with miR-29b-3p inhibitor or mimic. In (C), amounts of Akt2 as deduced from the chemiluminescence signals normalized with β-Tubulin. The asterisks indicate significant differences compared to transfection with scramble oligonucleotides (Negative control, NC), taken as 1. All the data represent the mean of three separate experiments ± SD. * p < 0.05.

