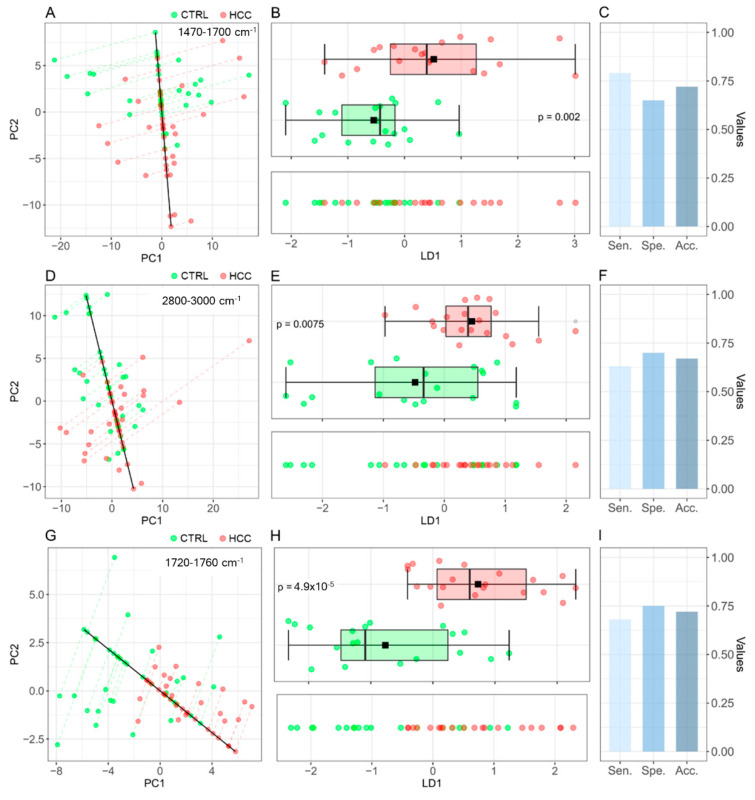
Figure 5.
(A) Projections of the spectral data in the PC1–PC2 plane for the region enclosed between 1470–1700 cm−1, together with the LD1 line (black continuous line), which maximizes the separation between controls (green points) and HCC patients (red points). (B) LD1 discriminant scores from the region enclosed between 1470 and 1700 cm−1 are reported in the lower panel. The presence of statistically significant difference between the LD1 scores of the two groups is supported by a box-plot analysis (upper panel). (C) The PCA-LDA (1470–1700 cm−1) classification performances are reported in terms of sensitivity, sensibility, and accuracy. (D–F) The same analyses were performed for the region enclosed between 2800–3000 cm−1 and (G–I) the region enclosed between 1720–1760 cm−1.

