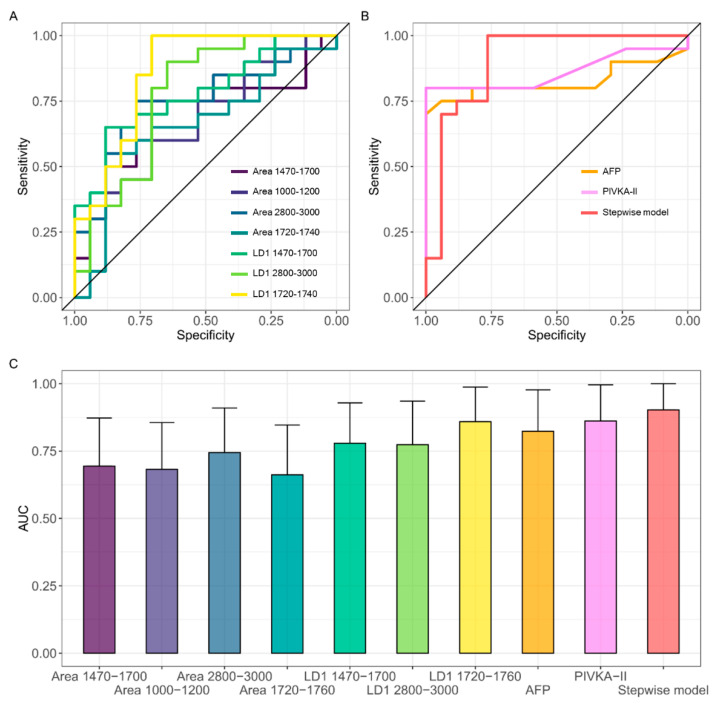
Figure 6.
ROC analysis of the all the analyzed spectral biomarkers (A) and of AFP (gold), PIVKA-II (violet), and of the combined spectral biomarkers obtained with stepwise logistic regression (red) (B); AUC values for each of the investigated markers, alone and in combination, together with the corresponding 95% confidence interval (C). The same color scale is used in the three panels.

