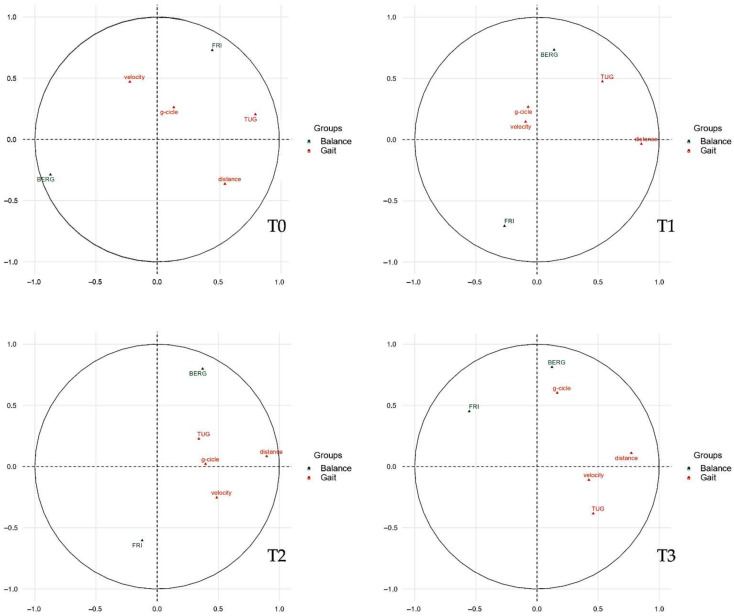
Figure 3.
Correlations between quantitative variables and dimensions. The plot depicts the topographical influence in the arrangement of the variables on the graph along the abscissa (Dim1) and the ordinate (Dim2). Abbreviations: BERG: Berg Balance Score; Dim1: dimension 1 (abscissa axis); Dim2, dimension 2 (ordinate axis); g-cycle: gait cycle; TUG: timed up-and-go; FRI: Fall Risk Index.

