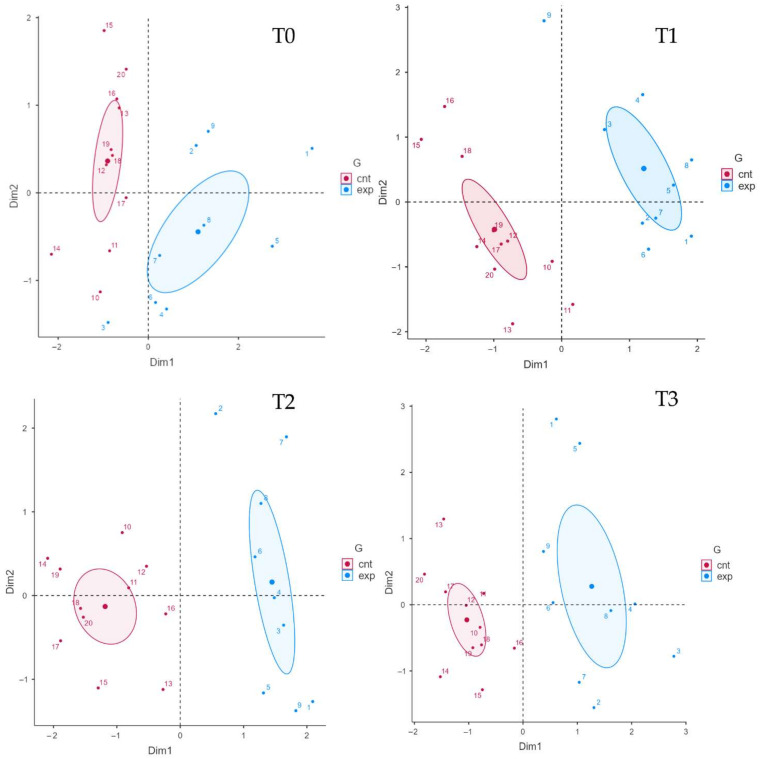
Figure 5.
Clustered individual factors map. Each individual is positioned according to the Cartesian axes and thickens in specific clusters that reflect the influences of the dimension and each variable. Abbreviations: cnt: control group (sham tDCS + physical therapy); Dim1: dimension 1 (abscissa axis); exp: experimental group (real tDCS + physical therapy); G: groups.

