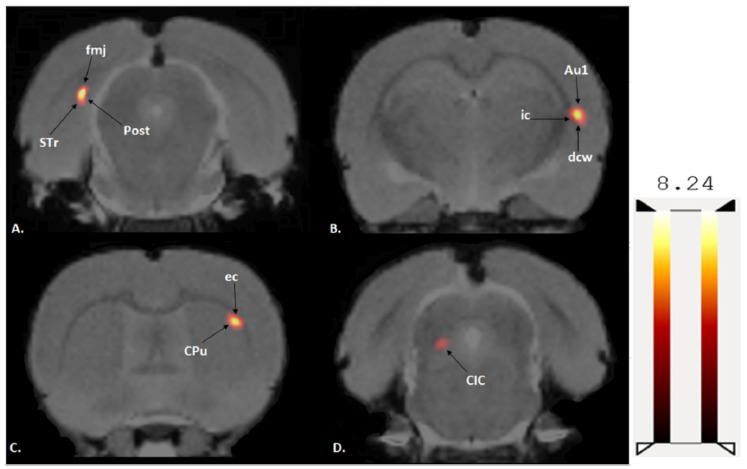
Figure 3.
Coronal PET images showing brain regions with significant (p < 0.001, df = 11, and K > 50) differences in brain glucose metabolism (BGluM) between exercised and sedentary rats. Hot scale clusters illustrate BGluM activation. The value 8.24 represents peak activation level, as expressed by the t-value: (A) fmj, Post, Subiculum, and STr; (B) ic, dcw, and Au1; (C) CPu and ec; and (D) CIC.

