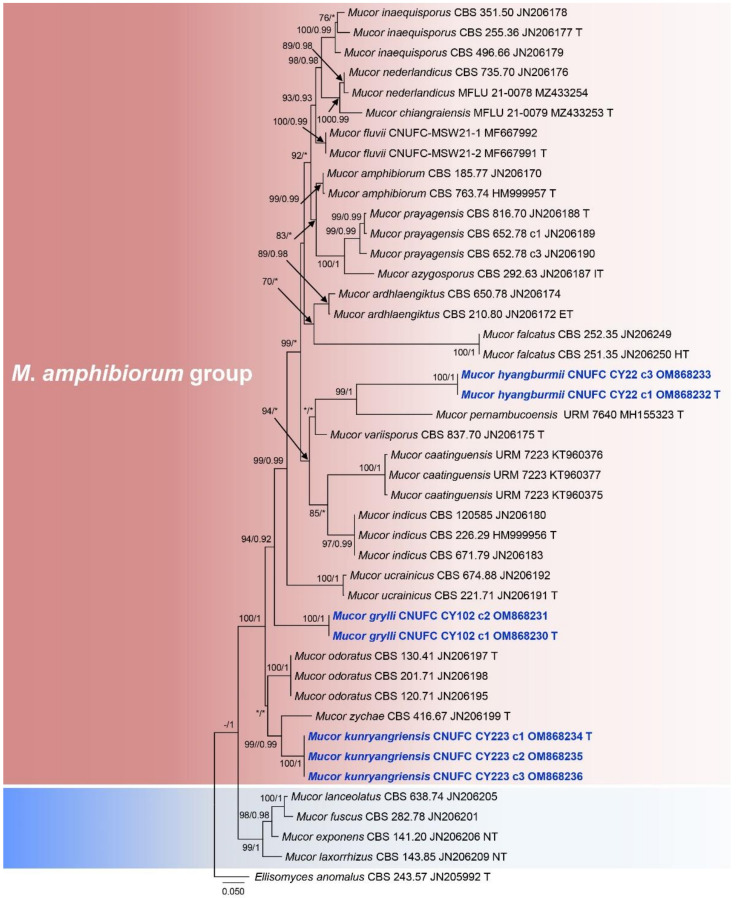
Figure 1.
Phylogenetic tree constructed by maximum likelihood analysis of the ITS. The numbers above branches represent maximum likelihood bootstrap percentages (left) and Bayesian posterior probabilities (right). Bootstrap values ≥70% and Bayesian posterior probabilities ≥0.90 are shown. Bootstrap values lower than 0.90 and 70% are marked with “*”, and absent bootstrap values are marked with “-”. The bar indicates the number of substitutions per position. Ellisomyces anomalus CBS 243.57 was used as outgroup. Type, ex-neotype, ex-holotype, and ex-epitype strains are marked with T, NT, HT, and ET, respectively. Newly generated sequences are in blue bold font.

