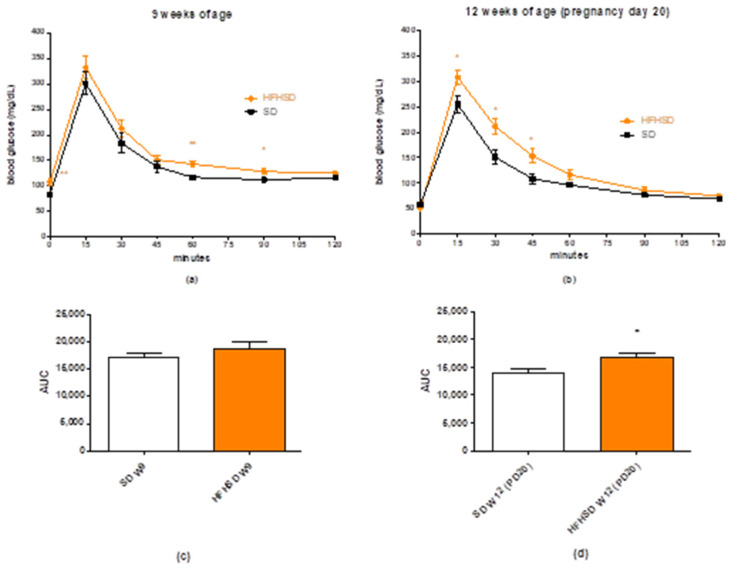
Figure 3.
Changes in plasma glucose levels during the glucose tolerance test (GTT) in standard diet (SD) and high fat high sugar diet (HFHSD)-fed rats at 9 and 12 weeks of age (W) (a,b). The rats become pregnant at 10 weeks of age, and the GTT was carried out on gestational day 20 (PD20). Each time point was compared between the SD and HFHSD groups. The plasma curves were compared by the calculation of area under curve (AUC) (c,d). HFHSD worsened glucose tolerance after 9 weeks of feeding. The statistical significance represents the differences between the SD and HFHSD groups at the same weeks of age *: p < 0.05; **: p < 0.01.

