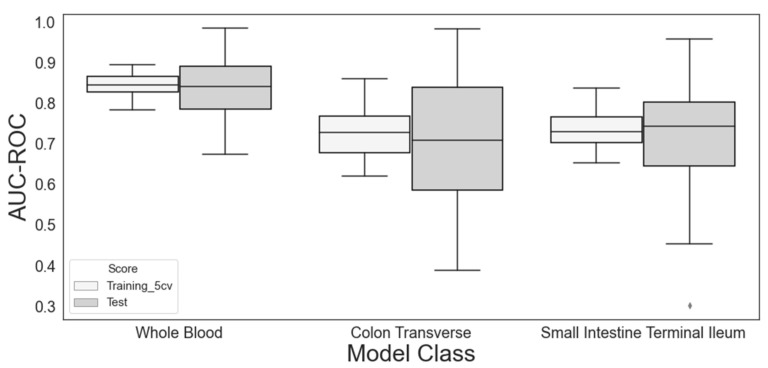
Figure 3.
Performance of the three tissue models used for gene expression imputation in classifying the non-durable response (NDR) vs. the durable response (DR). The model training by 5-fold cross-validation and feature selection via LASSO and recursive feature elimination was repeated 100 times (see main text for details). The single most significant gene was selected from each trial. The training and test performances given as area under the receiver operating characteristic curve (AUC-ROC) are shown as boxplots. That from the whole-blood model was significantly higher than that from the colon transverse (pt-test = 6.5 × 10−38 and 3.7 × 10⁻¹² for the training and test sets, respectively) or the small intestine terminal ileum (pt-test = 1.8 × 10−46 and 7.5 × 10⁻¹⁵ for the training and test sets, respectively).

