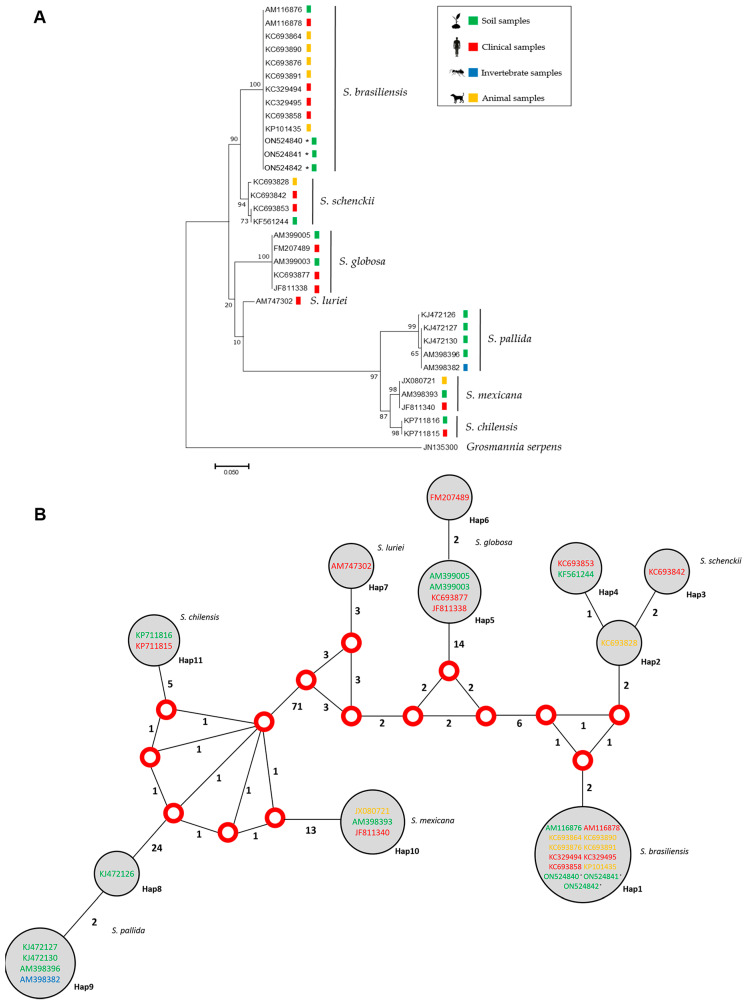
Figure 3.
(A) Maximum likelihood phylogenetic relationships based on calmodulin partial sequencing between members of clinical, animal and environmental isolates from the Sporothrix species with clinical interest. The colored squares represent the origin source of each isolate/sequence. (B) Median vector haplotype network demonstrating the phylogenetic relationships among the 33 isolates/sequences of the present study, demonstrating that, in both cases, the three sequences obtained grouped with S. brasiliensis. Red dots represent median vectors. Circle size is proportional to the frequency of isolates (h). The numbers around each vertex represent the amount of mutations separating each haplotype and the different colors in the Genbank code represent the isolate/sequence origins. * Indicate sequences generated in this work.

