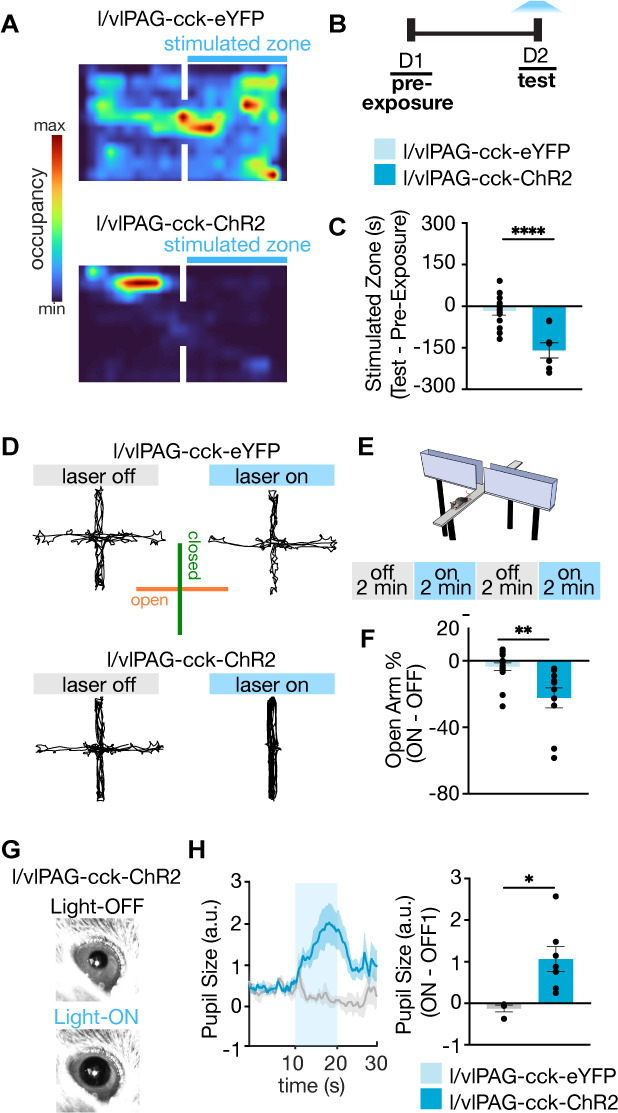
Figure 4. Further characterization of lateral/ventrolateral periaqueductal gray-cholecystokinin-expressing (l/vlPAG-CCK) neurons demonstrates stimulation is aversive, anxiogenic, and induces hallmark sympathetic responses.

(A) Example spatial map of real-time place test (RTPT) depicting min/max occupancy during test of a l/vlPAG-CCK-eYFP mouse (top) and l/vlPAG-CCK-ChR2 mouse (bottom). Blue light delivery was paired with occupancy of one chamber in the RTPT during the 10 min test. (B) Timeline for RTPT assay. Each session lasted 10 min. (C) Dots represent time spent in the stimulated zone during test minus time spent in the same zone during pre-exposure (without light delivery). Bars are averaged across l/vlPAG-CCK-eYFP and l/vlPAG-CCK-ChR2 groups, respectively. Stimulation of l/vlPAG-CCK neurons results in avoidance of stimulated zone, compared to control YFP group (eYFP, n = 14; ChR2, n = 8; unpaired t-test, ****p<0.0001). (D) Example locomotion maps of l/vlPAG-CCK-eYFP (top) and l/vlPAG-CCK-ChR2 mice (bottom) during light-off (left) and light-on (right) epochs. (E) Stimulation protocol in elevated plus maze (EPM) assay. (F) Dots represent percent of time spent in open arms during light-on epochs normalized by light-off epochs (ON minus OFF) of l/vlPAG-CCK-eYFP or l/vlPAG-CCK-ChR2 mice. Light delivery to ChR2 mice reduced open-arm occupancy relative to eYFP mice (eYFP, n = 16; ChR2, n = 10; unpaired t-test, **p=0.0024). (G) Example pupil images of a head-fixed l/vlPAG-CCK-ChR2 mouse without (top) and with blue-light delivery (bottom). (H) Left: average data showing pupil size during baseline, stimulation, and post-stimulation periods (labeled OFF, ON, and OFF, respectively). Each period lasted 10 s. During stimulation, blue light was delivered to l/vlPAG. Right: blue light delivery increased pupil size in l/vlPAG-CCK-ChR2 compared to l/vlPAG-CCK-eYFP mice (eYFP, n = 4; ChR2, n = 7; unpaired t-test, *p=0.0174). Errorbars: mean ± SEM.
