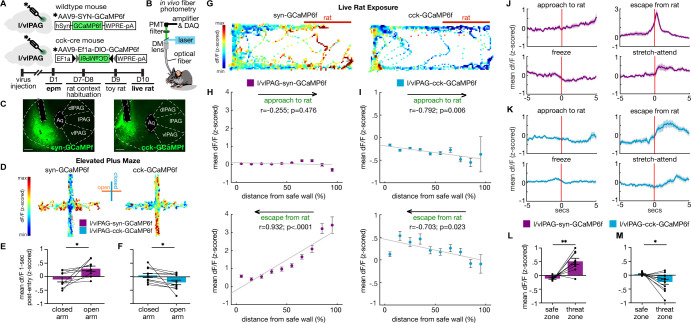
Figure 8. Lateral/ventrolateral periaqueductal gray-synapsin-expressing (l/vlPAG-syn) cells are more active near threat, while l/vlPAG-cholecystokinin-expressing (l/vlPAG-CCK) cells are more active far from threat.
(A) Top: viral schematic for synapsin-specific and CCK-specific GCaMP6 expression in l/vlPAG. Bottom: timeline for in vivo photometry recordings. (B) Fiber photometry recording set-up. (C) Histology of GCaMP6f expression in synapsin-specific (left) and CCK-specific (right) cells in the l/vlPAG. Scale bar, 200 μm. (D) Example heatmaps showing z-scored dF/F in mice expressing synapsin-specific GCaMP6 (left) or CCK-specific GCaMP6 (right) in l/vlPAG in an elevated plus maze assay. Vertical arms of heatmaps represent closed arms. (E, F) Mean dF/F (z-scored) 1 s after arm entry in syn-GCaMP6 (E) and CCK-GCaMP6 mice (F). Mean dF/F 1 s post-entry into the open arms is greater than into closed arms in syn-GCaMP6 mice (E, n = 9; paired t-test, *p=0.0213), whereas mean dF/F 1 s post-entry into the open arms is lower than into the closed arms for CCK-GCaMP6 mice (F, n = 11; paired t-test, *p=0.0283). (G) Example heatmaps showing z-scored dF/F in syn-GCaMP6 (left) or CCK-GCaMP6 (right) in live rat exposure assay. Rat was confined to the right of the map, as indicated by the red bar. (H, I) Mean dF/F (z-scored) during approaches toward the rat (top) or escapes from the rat (bottom) within 10 spatial bins of varying distance from the safe wall of syn-GCaMP6 (H, n = 9) or CCK-GCaMP6 (I, n = 13) mice (syn-approach, n = 6744 samples; syn-escape, n = 2150 samples; CCK-approach, n = 7170 samples; CCK-escape, n = 2088 samples). (H) In syn-GCaMP6f mice, dF/F is positively correlated with distance from the safe wall during escapes from the predator (Pearson’s correlation coefficient r = 0.932, p<0.0001). (I) In CCK-GCaMP6f mice, dF/F is negatively correlated with distance from safe wall during both approaches and escapes (approach, r = −0.792, p=0.006; escape, r = –0.703, p=0.023). (J, K) Mean dF/F (z-scored) 5 s before and after approaches, escapes, freeze bouts, and stretch-attend postures in syn-GCaMP6 (L) and CCK-GCaMP6 (M) populations (syn, n = 9; CCK, n = 13 for freeze, n = 12 for other behaviors). (L, M) Mean dF/F (z-scored) in the safer zone (one-third of assay near safer wall) and threat zone (two-thirds of assay distal from safer wall) in syn-GCaMP6 and CCK-GCaMP6 mice. Pan-neuronal l/vlPAG activity was increased in the threat zone compared to the safer zone (syn, n = 9; paired t-test, **p=0.0024), whereas CCK-specific activity was decreased in the threat zone compared to the safer zone (CCK, n = 12; paired t-test, *p=0.0223). Errorbars: mean ± SEM.
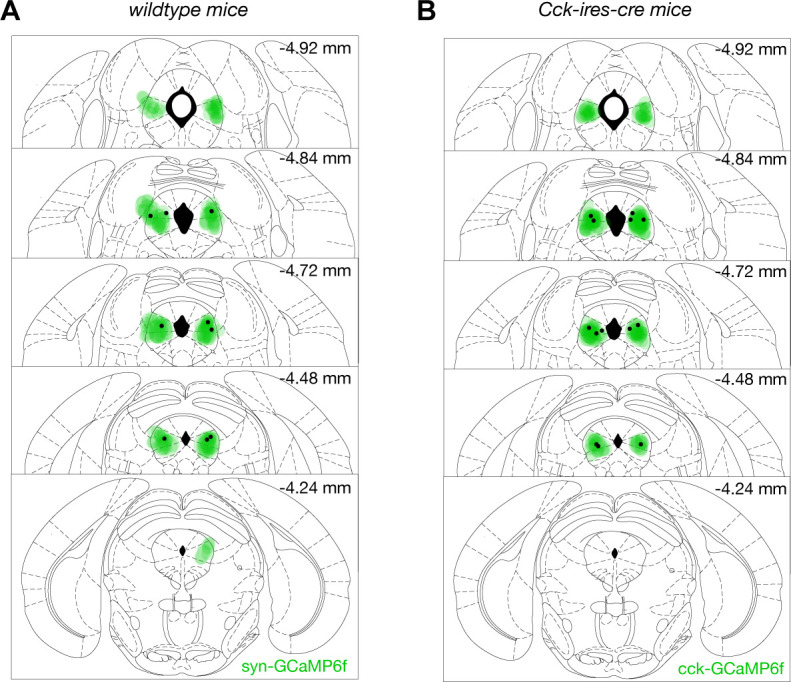
Figure 8—figure supplement 1. GCaMP6f expression and fiber placement in the lateral/ventrolateral periaqueductal gray (l/vlPAG) in coronal brain sections.

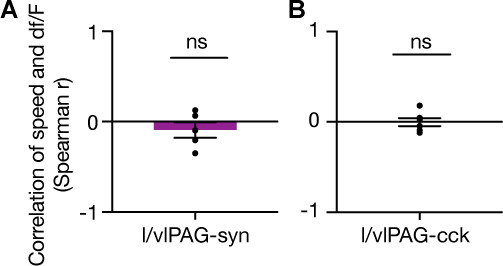
Figure 8—figure supplement 2. No correlation between speed and df/F.


