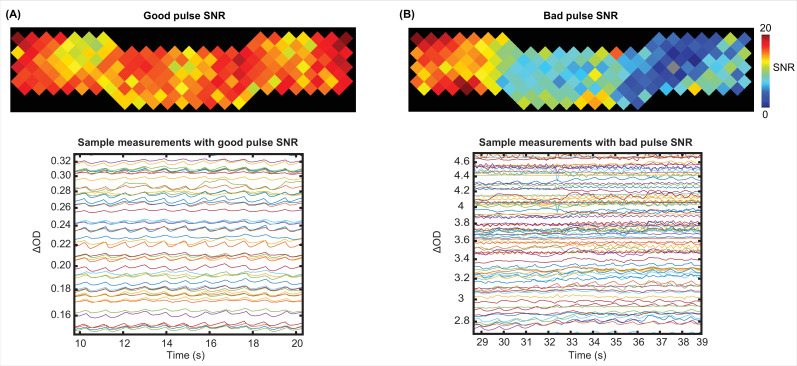
Appendix 1—figure 3. Examples of a good and a bad pulse signal-to-noise ratio (SNR) in high-density diffuse optical tomography (HD-DOT) data.
Example pulse SNR plot and a selection of the measurements from the HD-DOT array for (A) a high-quality pulse SNR, and (B) a low-quality pulse SNR. Note the heartbeat frequency (~1 Hz) that appears as around 10 peaks in 10 s.

