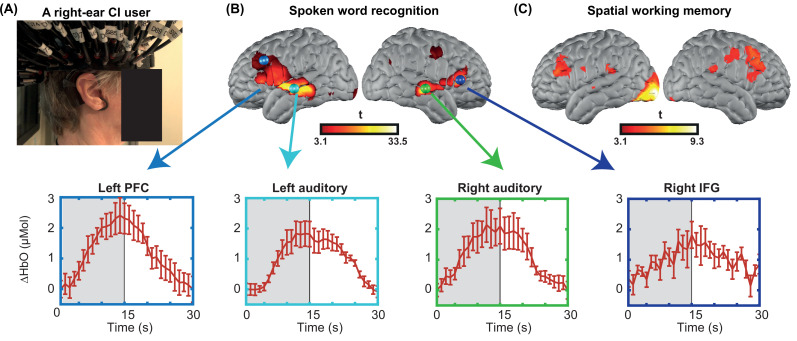
Figure 1. Single-subject data from one cochlear implant (CI) user across multiple sessions.
(A) A CI user wearing the high-density diffuse optical tomography (HD-DOT) cap. (B) Response to the spoken words across six sessions (36 min of data). Hemodynamic response time-traces are plotted for peak activation values across six sessions for four brain regions. The seed colors match the plot boundaries with error bars indicating the standard error of the mean over n=12 runs of data. Gray shaded region indicates period during which words are presented. (C) Response to the spatial working memory task for the same CI user across four sessions (32 min of data).

