. 2022 Jun 6;11:e75323. doi: 10.7554/eLife.75323

Figure 2. Spoken word recognition group maps.

Response to the spoken words in (A) 18 controls and (B) 20 right ear cochlear implant (CI) users. (C) Differential activation in response to the spoken words task in CIs>controls highlights the group differences. The first column shows unthresholded β maps and the second column shows t-statistic maps thresholded at voxelwise p<0.05 (uncorrected) for each group.

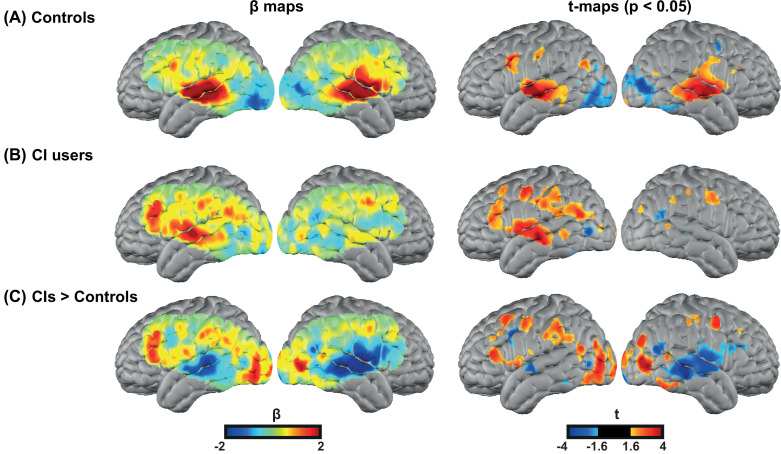
Figure 2.

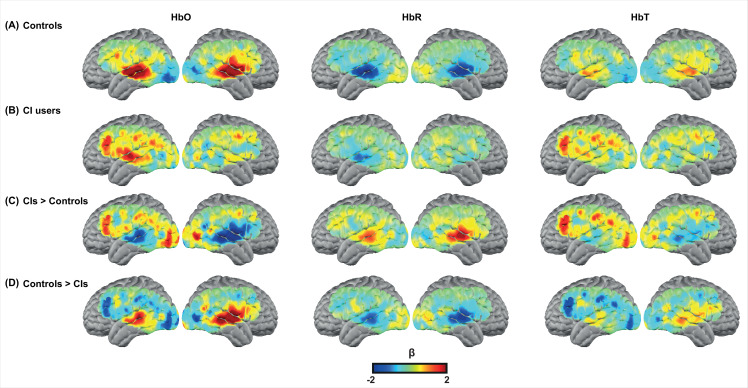
Figure 2—figure supplement 1. Group results for different hemoglobin contrasts.

Figure 2—figure supplement 1.

β maps of oxy (column 1, HbO), deoxy (column 2, HbR), and total (column 3, HbT) hemoglobin for the spoken word recognition task for (A) all controls, (B) all cochlear implant (CI) users, (C) CIs>controls, and (D) Controls>CIs. Note that the first three rows in column 1 (HbO) are identical to the results shown in Figure 2 column 1. The redundancy is to guide the reader for side-by-side comparisons with HbR and HbT results.