. 2022 Jun 6;11:e75323. doi: 10.7554/eLife.75323

Figure 3. Region of interest (ROI)-based statistical analysis for spoken word recognition task.

Unthresholded t-maps in response to the spoken words spatially masked in the three ROIs for (A) 18 controls, (B) 20 right ear cochlear implant (CI) users, and (C) CIs>controls, highlight the group differences in certain brain areas. (D) Temporal profile of the hemodynamic response in three selected ROIs (left prefrontal cortex [PFC], left auditory, and right auditory cortices). The error bars indicate the standard error of the mean over n=20 for CI users and n=18 for controls. Two-sample t-tests for mean β value in each ROI have been calculated between controls and the CI user group, confirming a significant increase in left PFC (p=0.015) and a significant decrease in the right auditory cortex (p=0.0017) in CI users (indicated by an asterisk above their corresponding box plots, corrected for multiple comparisons). The observed change in the left auditory cortex was not significant (p=0.15).

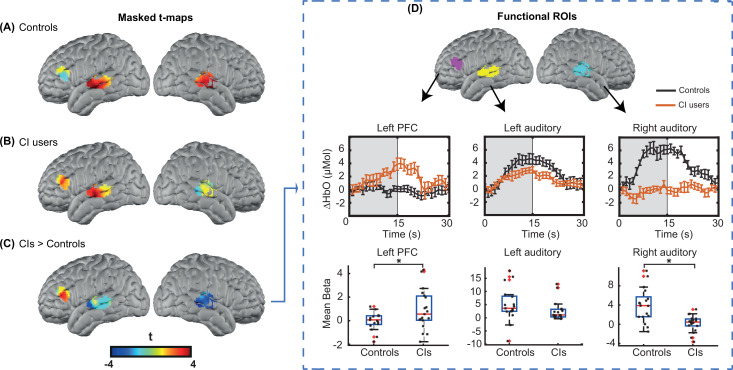
Figure 3—source data 1. Noisy source-detector numbers are provided along with the threshold used for identifying them for each cochlear implant (CI) user.

Figure 3.

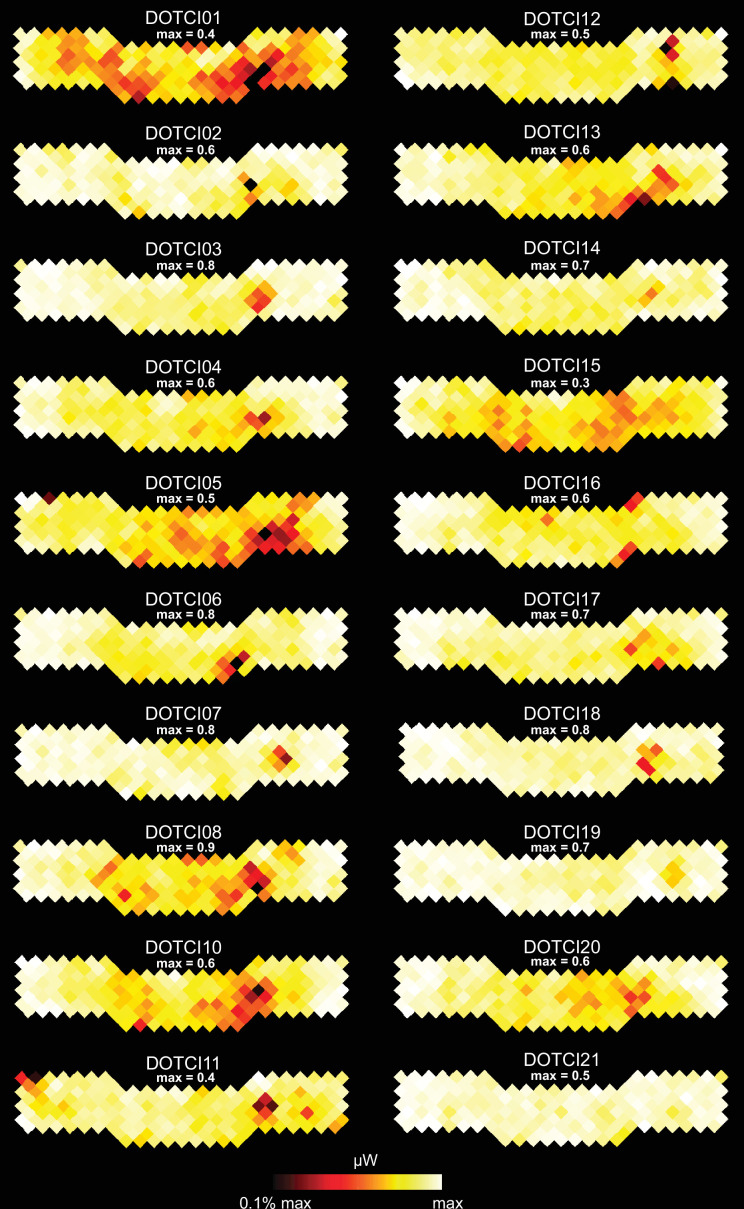
Figure 3—figure supplement 1. Coupling coefficients of each source and detector is shown in a flat view for all cochlear implant (CI) users included in the study.

Figure 3—figure supplement 1.

The dark red areas show the location of the signal drop for each CI user. The maximum coupling coefficient for each subject is shown above each plot.
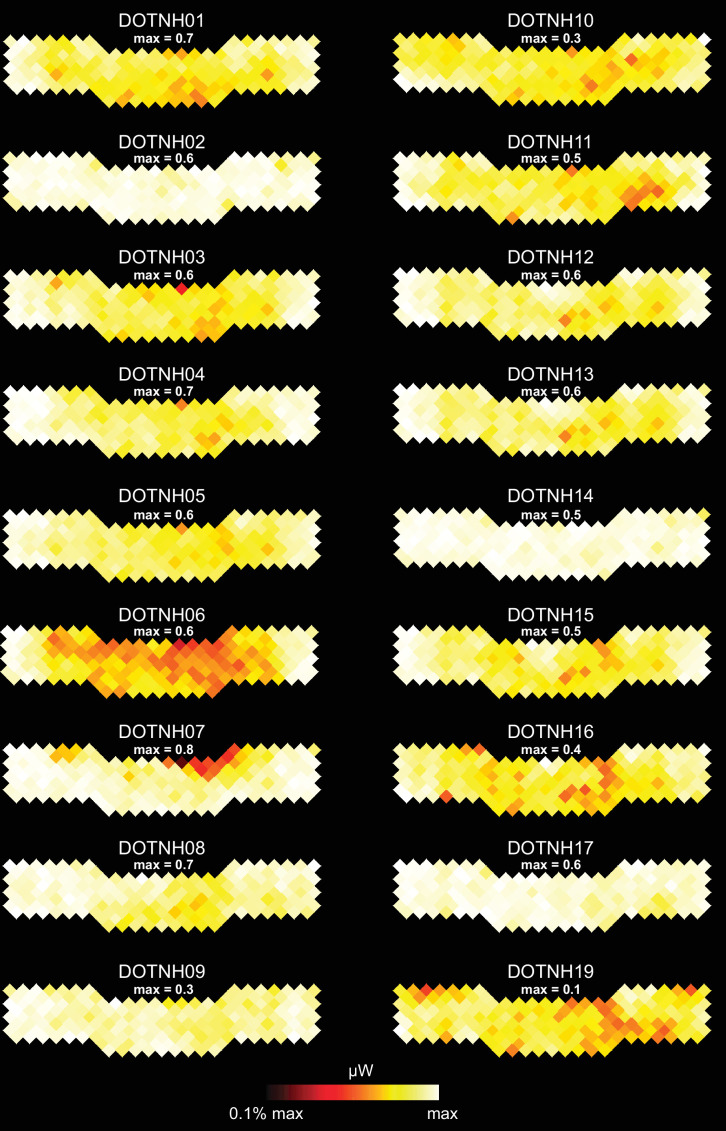
Figure 3—figure supplement 2. Coupling coefficients of each source and detector is shown in a flat view for all controls included in the study.

Figure 3—figure supplement 2.

The maximum coupling coefficient for each subject is shown above each plot.
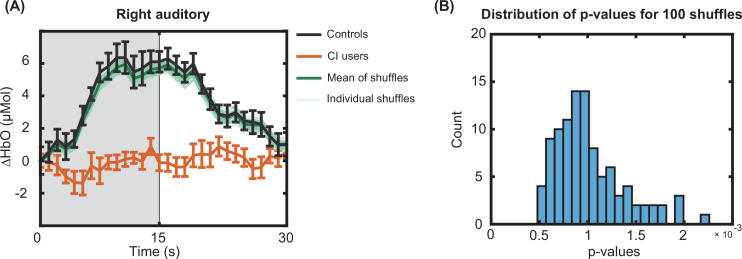
Figure 3—figure supplement 3. Effect of the simulated cochlear implant (CI) transducer in controls in the right auditory region of interest (ROI) analysis.

Figure 3—figure supplement 3.

(A) Replicating the ROI analysis for the right auditory cortex using 100 different shuffles of pre-processing for 18 controls by simulating the effect of the CI transducer. The error bars indicate the standard error of the mean over n=20 for CI users and n=18 for controls. (B) Histogram of the p-values shows statistical significance (p<0.016 corrected) for all 100 shuffles across CI users and controls as found in the original pre-processing in the right auditory ROI in Figure 3.