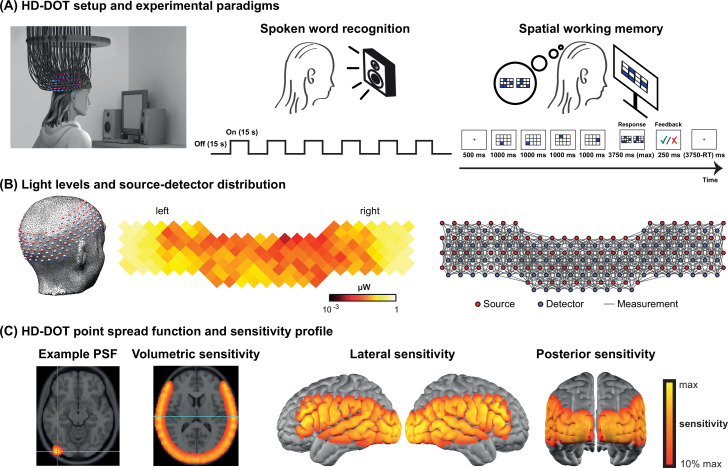
Figure 5. High-density diffuse optical tomography (HD-DOT) system and the experimental design.
(A) Schematic of a subject wearing the HD-DOT cap along with an illustration of the task design. (B) Simplified illustration of the HD-DOT system (far left), regional distribution of source-detector light levels (middle), and source-detector pair measurements (~1200 pairs) as gray solid lines illustrated in a flat view of the HD-DOT cap (far right). (C) An example point spread function (PSF) and the HD-DOT sensitivity profile illustrated on the volume and spatially registered on the cortical view of a standard atlas in lateral and posterior views.

